

Synchrony of sylvatic dengue isolations: a multi-host, multi-vector SIR model of dengue virus transmission in Senegal
- PMID: 23209867
- PMCID: PMC3510077
- DOI: 10.1371/journal.pntd.0001928
Synchrony of sylvatic dengue isolations: a multi-host, multi-vector SIR model of dengue virus transmission in Senegal
Abstract
Isolations of sylvatic dengue-2 virus from mosquitoes, humans and non-human primates in Senegal show synchronized multi-annual dynamics over the past 50 years. Host demography has been shown to directly affect the period between epidemics in other pathogen systems, therefore, one might expect unsynchronized multi-annual cycles occurring in hosts with dramatically different birth rates and life spans. However, in Senegal, we observe a single synchronized eight-year cycle across all vector species, suggesting synchronized dynamics in all vertebrate hosts. In the current study, we aim to explore two specific hypotheses: 1) primates with different demographics will experience outbreaks of dengue at different periodicities when observed as isolated systems, and that coupling of these subsystems through mosquito biting will act to synchronize incidence; and 2) the eight-year periodicity of isolations observed across multiple primate species is the result of long-term cycling in population immunity in the host populations. To test these hypotheses, we develop a multi-host, multi-vector Susceptible, Infected, Removed (SIR) model to explore the effects of coupling multiple host-vector systems of dengue virus transmission through cross-species biting rates. We find that under small amounts of coupling, incidence in the host species synchronize. Long-period multi-annual dynamics are observed only when prevalence in troughs reaches vanishingly small levels (< 10(-10)), suggesting that these dynamics are inconsistent with sustained transmission in this setting, but are consistent with local dengue virus extinctions followed by reintroductions. Inclusion of a constant introduction of infectious individuals into the system causes the multi-annual periods to shrink, while the effects of coupling remain the same. Inclusion of a stochastic rate of introduction allows for multi-annual periods at a cost of reduced synchrony. Thus, we conclude that the eight-year period separating amplifications of dengue may be explained by cycling in immunity with stochastic introductions.
Conflict of interest statement
The authors have declared that no competing interests exist.
Figures
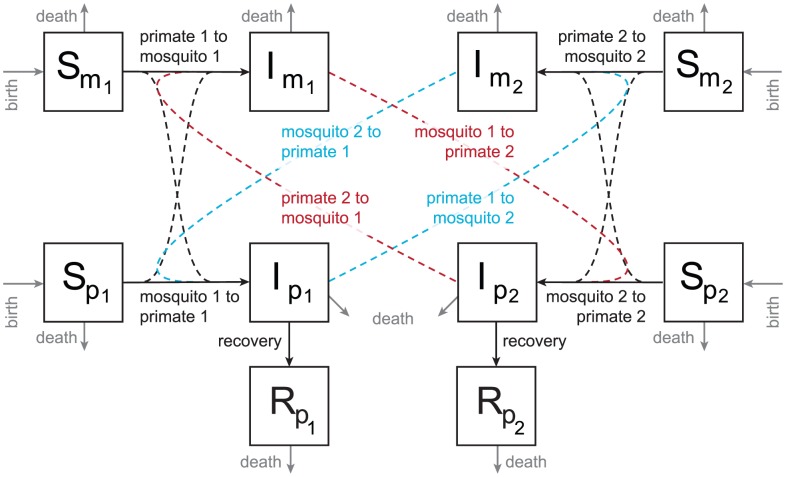
 and primate
  which is symmetric (e.g. “mosquito 2 to primate 1”), as well as a seasonally-varying probability of infection term which is asymmetric for primates and mosquitoes. Primates recover at rate “recovery”. Mosquitoes and primates birth and death rates are represented in grey (labeled “birth” and “death”, respectively). See the text for more detail, and the Supporting Information S1 for model equations.
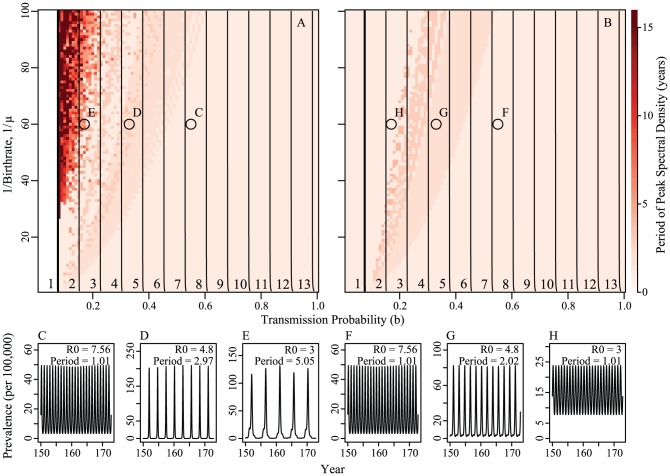
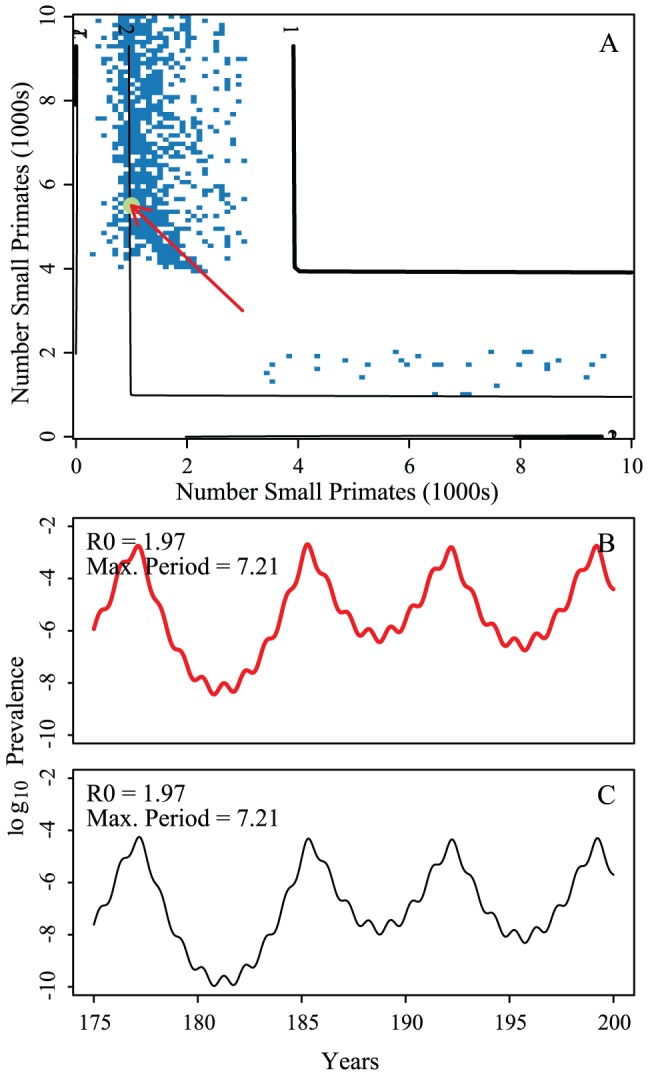
 per year rate of infection introduction, respectively. Circles indicate example epidemic time series shown in panels C–H. Contour lines are analytically calculated values of
  (see Supporting Information S1). Other parameters held fixed:
  ,
,  ,
,  ,
,  , and
, and  .
.
 and
and  ). The only parameter difference between panels A–D and panels E–H are the off-diagonal biting rates. Contour lines are analytically calculated values of
  (see Supporting Information S1). The dynamics in the mosquito population are qualitatively identical and can be found in Figure S5. Other parameters are:
  ,
,  ,
,  ,
,  ,
,  , and
, and  ,
,  .
.
 and
and  are coupled at 1/500th of the on-diagonal biting rates. Contour lines are analytically calculated values of
  (see Supporting Information S1). The dynamics in the mosquito population are qualitatively identical and can be found in Figure S6. Other parameter values are:
  ,
,  ,
,  ,
,  ,
,  , and
, and  ,
,  .
.
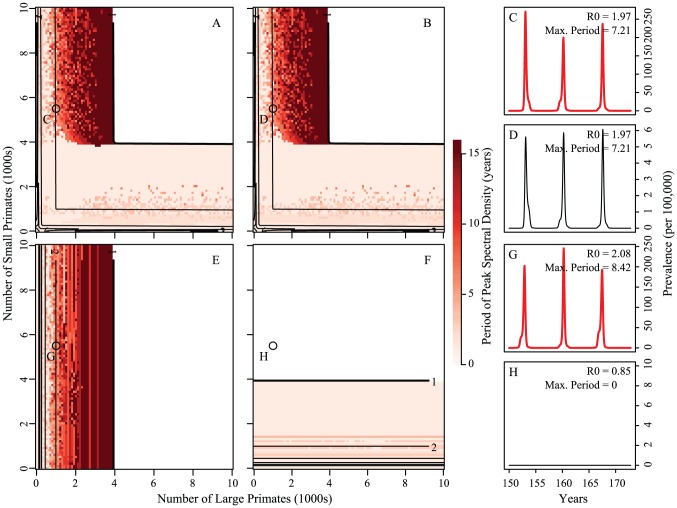
 for both hosts and vectors equal to 0.16 and
  and 1/17.5 for the large and small primates, respectively. Fourier spectra for the large and small primate time series are shown in panels E and F, respectively. Panels G and H are scatterplots of the number of primate infections versus number of mosquito infections for the large and small primates and their corresponding mosquitoes, respectively. We see transmission dynamics in primates and mosquitoes are highly correlated. The coupling is 1/100 of the on-diagonal biting rates; other parameters are:
  ,
,  ,
,  ,
,  ,
,  , and
, and  ,
,  ,
,  .
.References
Publication types
MeSH terms
Grants and funding
LinkOut - more resources
Full Text Sources
Medical
Miscellaneous
