Single-molecule fluorescence quantification with a photobleached internal standard
- PMID: 23210507
- PMCID: PMC3526837
- DOI: 10.1021/ac303032m
Single-molecule fluorescence quantification with a photobleached internal standard
Abstract
In cellular and molecular biology, fluorophores are employed to aid in tracking and quantifying molecules involved in cellular function. We previously developed a sensitive single-molecule quantification technique to count the number of proteins and the variation of the protein number over the population of individual subcellular organelles. However, environmental effects on the fluorescent intensity of fluorophores can make it difficult to accurately quantify proteins using these sensitive techniques. In this letter, we demonstrate the use of photobleaching to extract an accurate single-molecule calibration intensity distribution from the sample directly to avoid any differences in environment that may alter the count. Using this technique, we were able to show that goat antimouse IgG antibody labeled with Alexa Fluor 488, an environmentally insensitive fluorophore, exhibited an average fluorescence equivalent to 4.6 single fluorophores. SynaptopHluorin vesicles, which contain the environmentally sensitive green fluorescent protein, exhibited an average of 4.4 single green fluorescent proteins per vesicle.
Figures

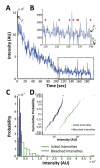
 ). The photobleaching track was terminated after the punctum was no longer observed for a designated number of frames (nc0 = 10 frames). Once the track was terminated, the final intensity, Ff, was extracted from the photobleaching track. (C) Initial and final intensity distributions ({Fi} and {Ff}) for all acceptable vesicles in a single photobleaching series. (D) Semi-log cumulative probability plots of {Fi} and {Ff} showing the conservation of the distribution shape during bleaching.
References
Publication types
MeSH terms
Substances
Grants and funding
LinkOut - more resources
Full Text Sources

