

Review
doi: 10.1021/cr200358s.
Epub 2012 Dec 5.
X-ray-computed tomography contrast agents
Affiliations
- PMID: 23210836
- PMCID: PMC3878741
- DOI: 10.1021/cr200358s
Item in Clipboard
Review
X-ray-computed tomography contrast agents
Chem Rev.
.
No abstract available
Conflict of interest statement
The authors have no conflict of interest.
Figures
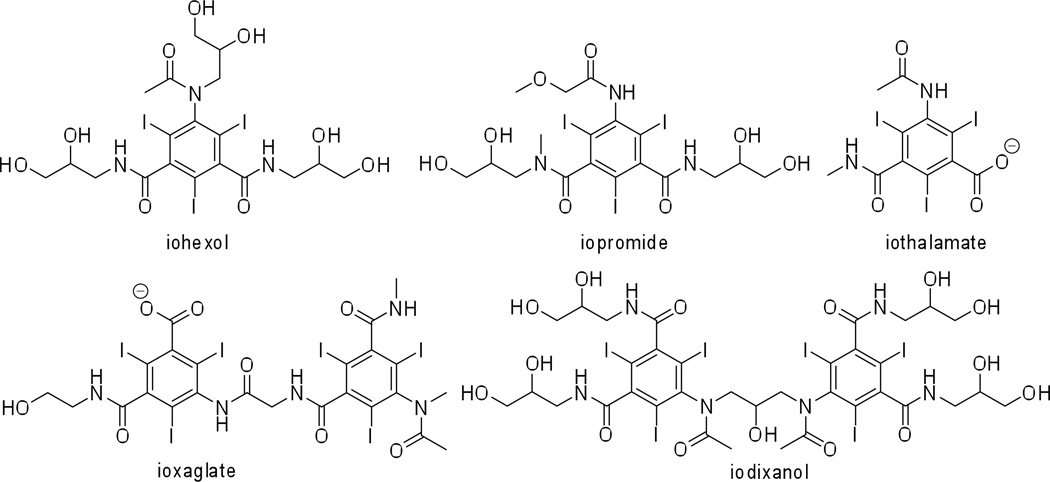
Structures of some commercially available clinically approved CT contrast agents.
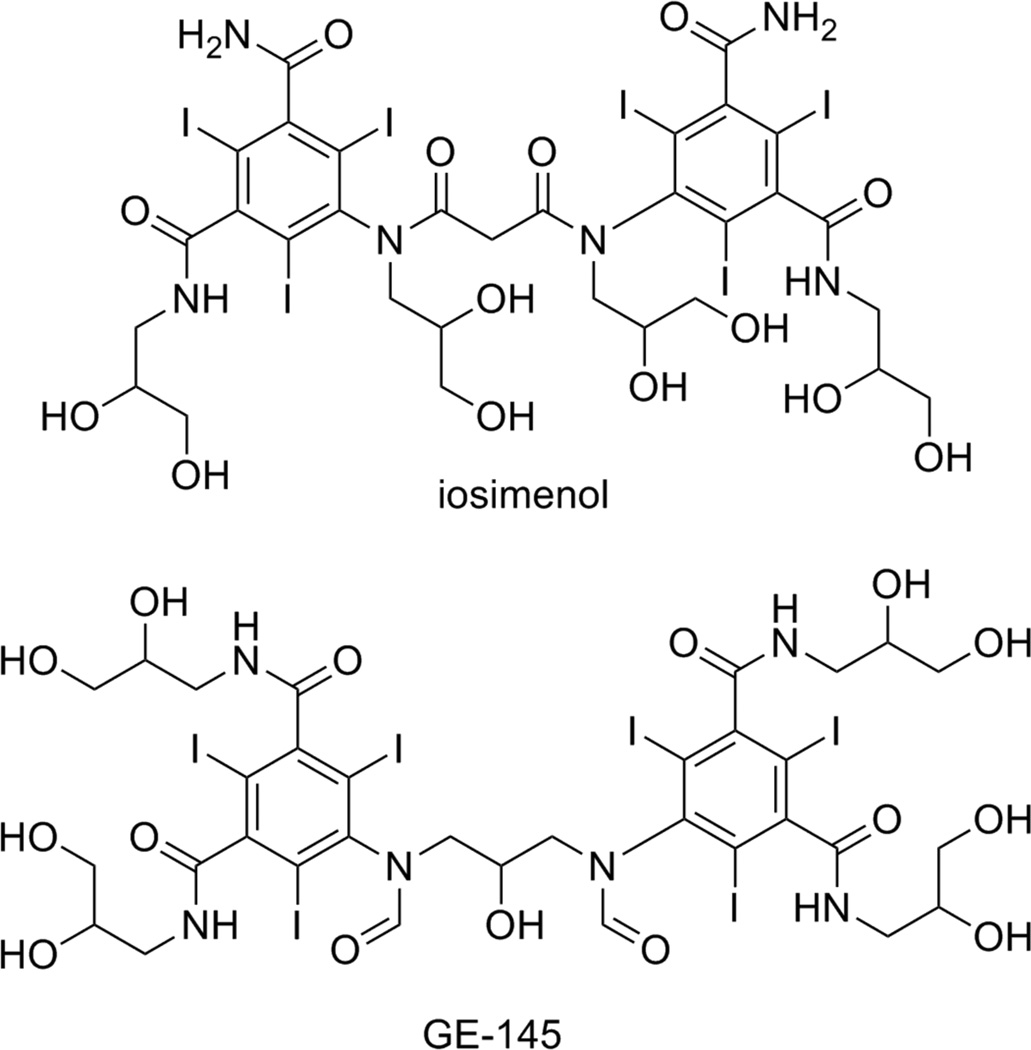
Two of the novel low-osmolality, non-ionic contrast agents.
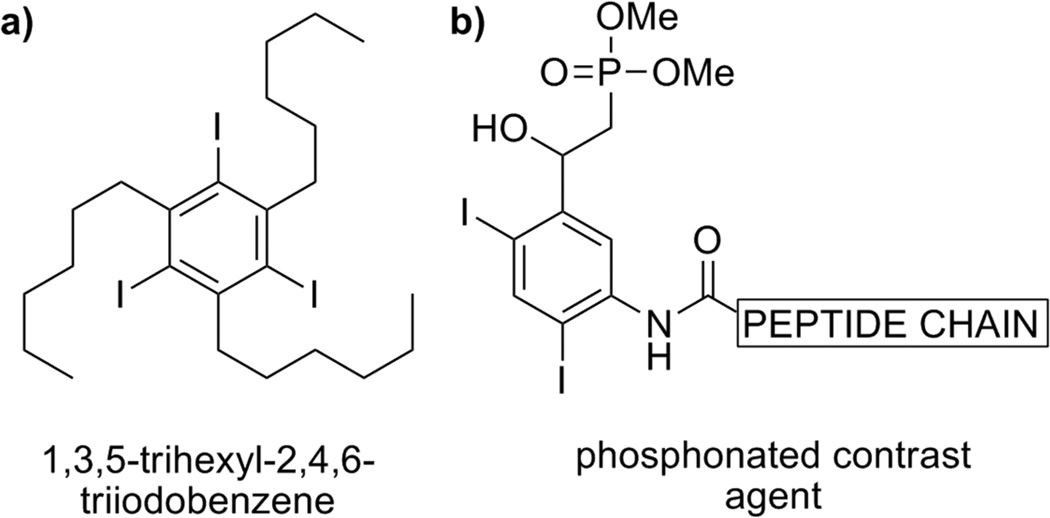
Two of the several proposed contrast agents: a) for gastrointestinal imaging; b) as potential targeted contrast agents.
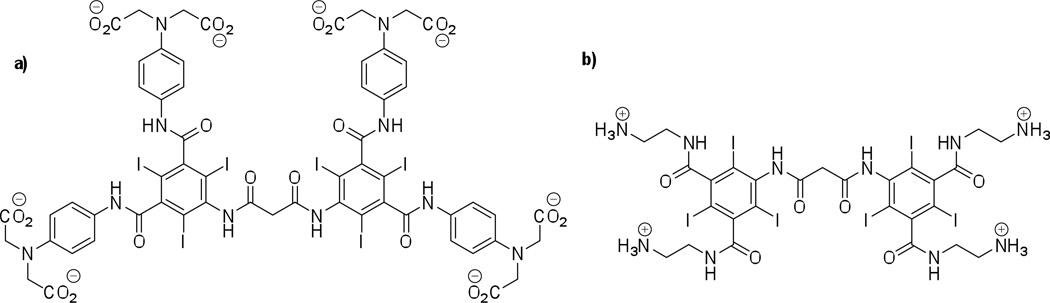
Structures of two novel tissue-specific small-molecule iodinated CT contrast agents; a) an anionic Ca2+ chelating contrast agent for bone microdamage imaging; b) a cationic contrast agent “CA4+” for cartilage tissue imaging.
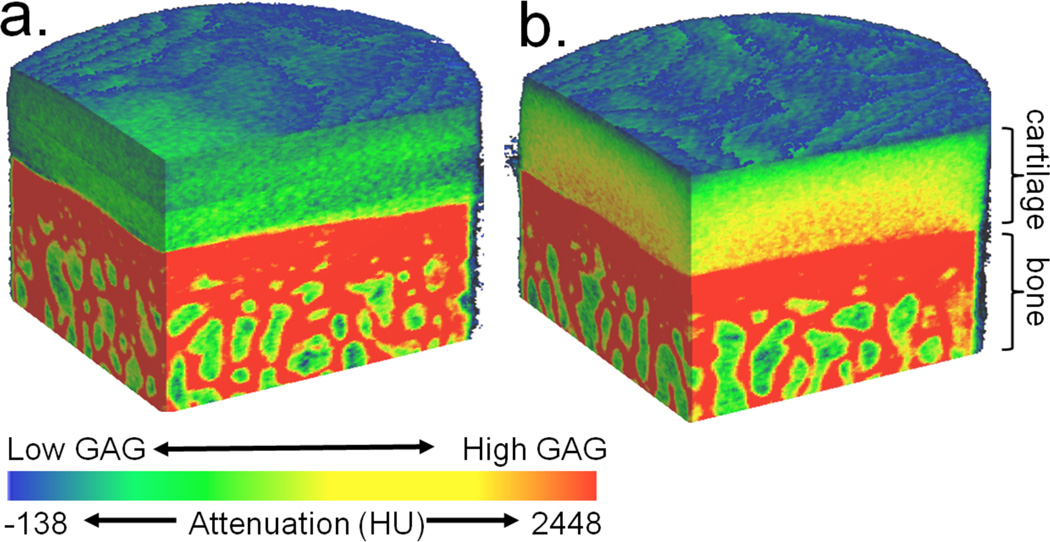
3D contrast enhanced CT attenuation color-map images ex vivo bovine femur cartilage after immersion in a.) ioxaglate or b.) CA4+ contrast agent. Visible correlation between the GAG content and cationic (CA4+) contrast agent can be observed in the imaging of cartilage (b.). No such correlation is observed for anionic contrast agent ioxaglate (a.). Ioxaglate solution concentration 16 mg I/mL; CA4+ solution concentration 8 mg I/mL. The approximate cartilage and bone sections are labeled. (Images from author, unpublished data.)
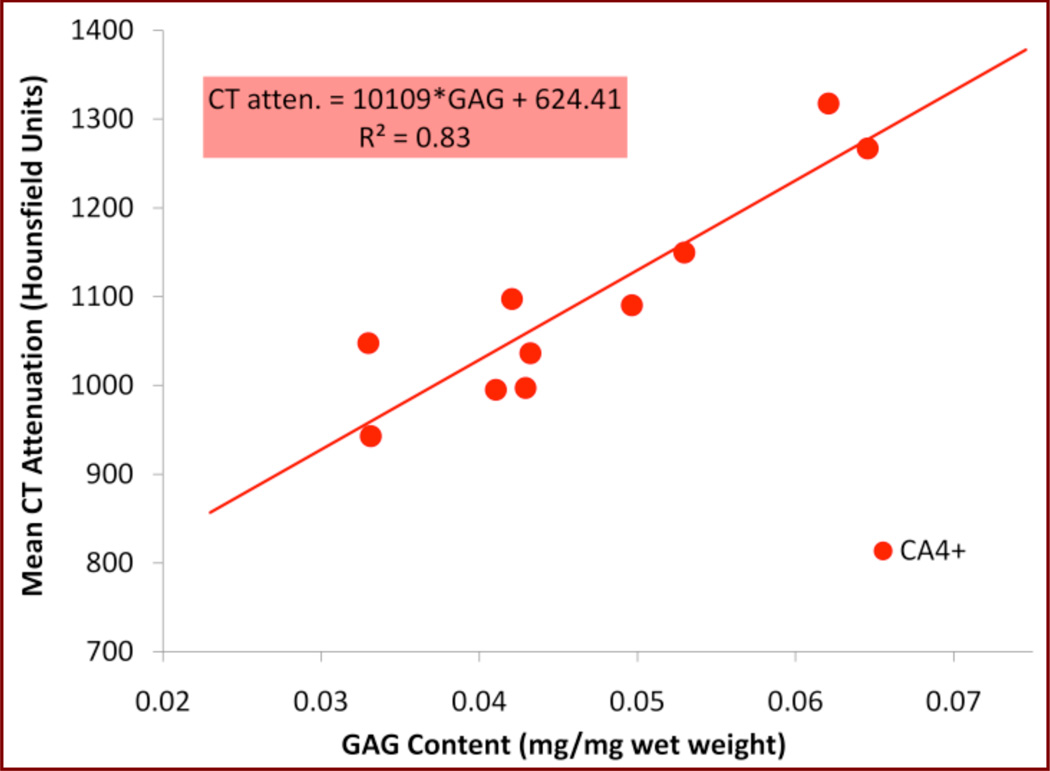
Linear regression analysis of average CT attenuation (in HU) vs. GAG content of cartilage (reported as [mg of GAG]/[mg of hydrated cartilage]) using the CA4+ contrast agent. The study was performed on healthy bovine femoral cartilage plugs. Samples were prepared for biochemical analysis using the 1,9-dimethylmethylene blue (DMMB) colorimetric assay. (Image from author, unpublished data).
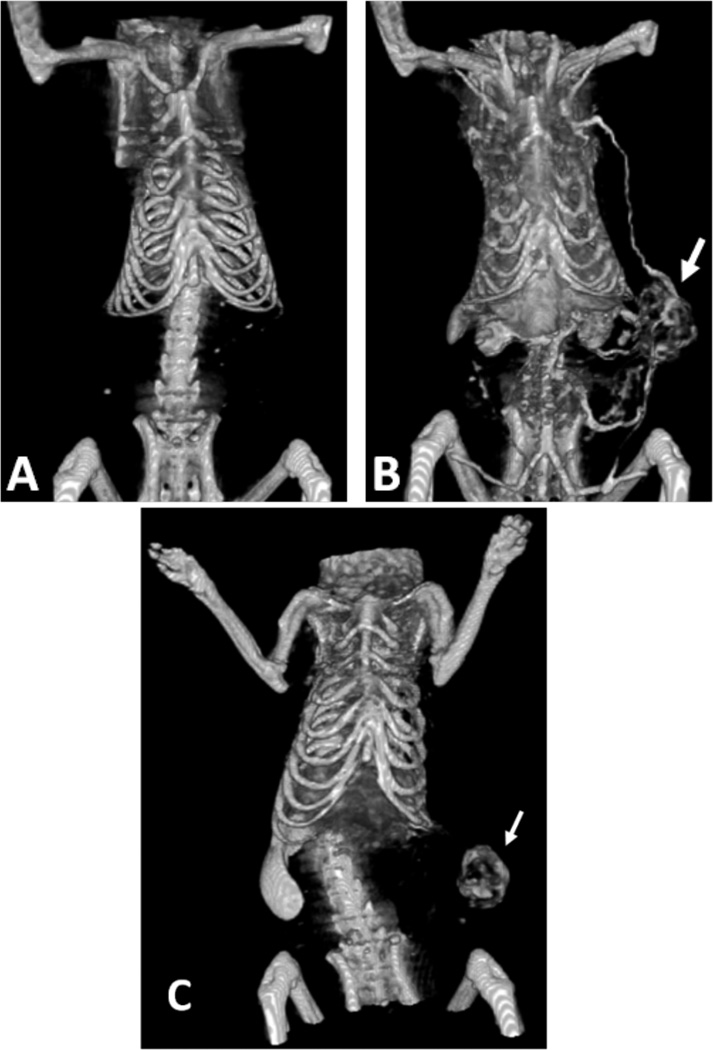
Whole body CT images of rat with MatBIII breast tumor (arrow) in left flank A) before, and B) 5 minutes after i.v. administration of liposomal contrast agent (2 g of iodine per kg), demonstrating ability to visualize tumor vasculature. C) Accumulation of the contrast agent within tumor allowing for non-invasive visualization of tumor blood vessel permeability. Probe accumulation is visible within tumor (arrow) as well as the liver and spleen, which are responsible for nanocarrier clearance. Image was obtained 3 days after i.v. administration of contrast (455 mg of iodine per kg) using a clinical cone beam CT scanner (Koning Corporation). (Images courtesy of Dr Kathleen McNeeley; Georgia Institute of Technology, Atlanta, GA.)
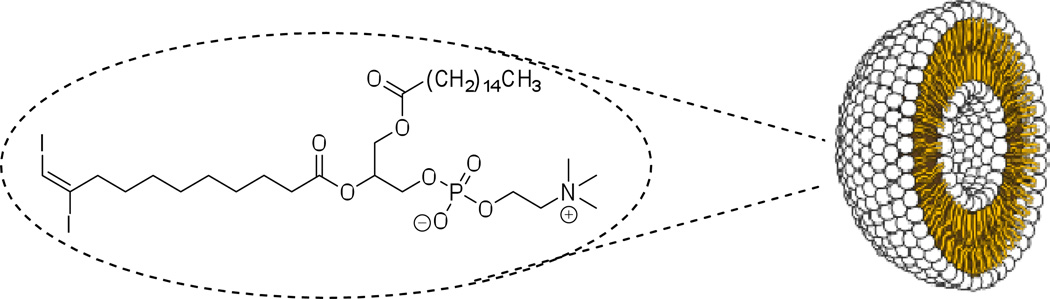
Liposomal CT contrast agent prepared from a diiodophosphatidylcholine, with iodine covalently incorporated into the bilayer shell, providing an empty cavity with potential drug-delivery applications.
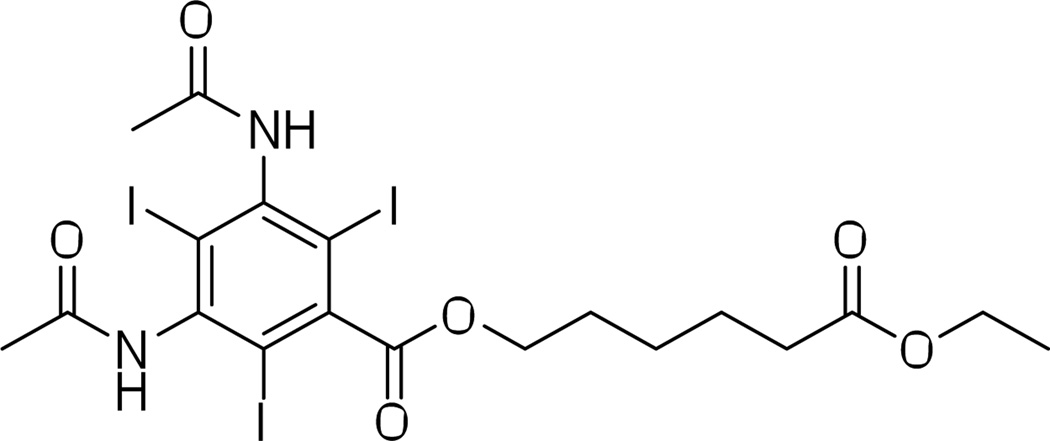
Molecular structure of the nanoparticulate contrast agent 6-ethoxy-6-oxohexyl 3,5-diacetamido-2,4,6-triiodobenzoate (N1177).
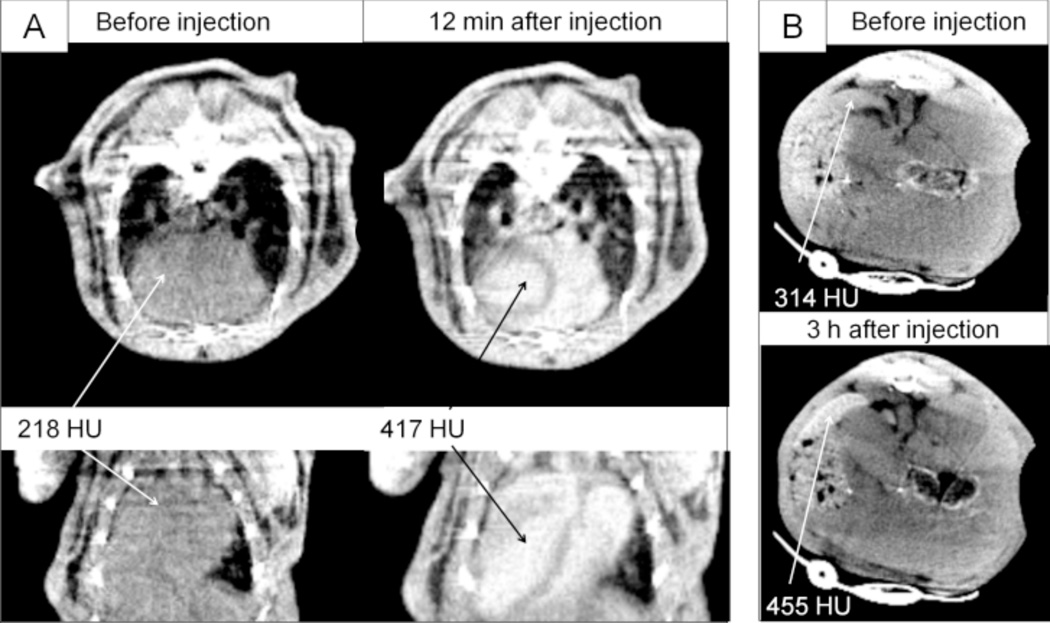
In vivo CT images and opacification (in HU) after i.v. injection of PBD-PEO nanoemulsion contrast agent in mice; A) the heart before, and 12 min post-injection, transversal (top row) and coronal (bottom row); B) the spleen before, and 3 h post-injection. (Reprinted with permission from ref. . Copyright 2010 Elsevier Ltd.)
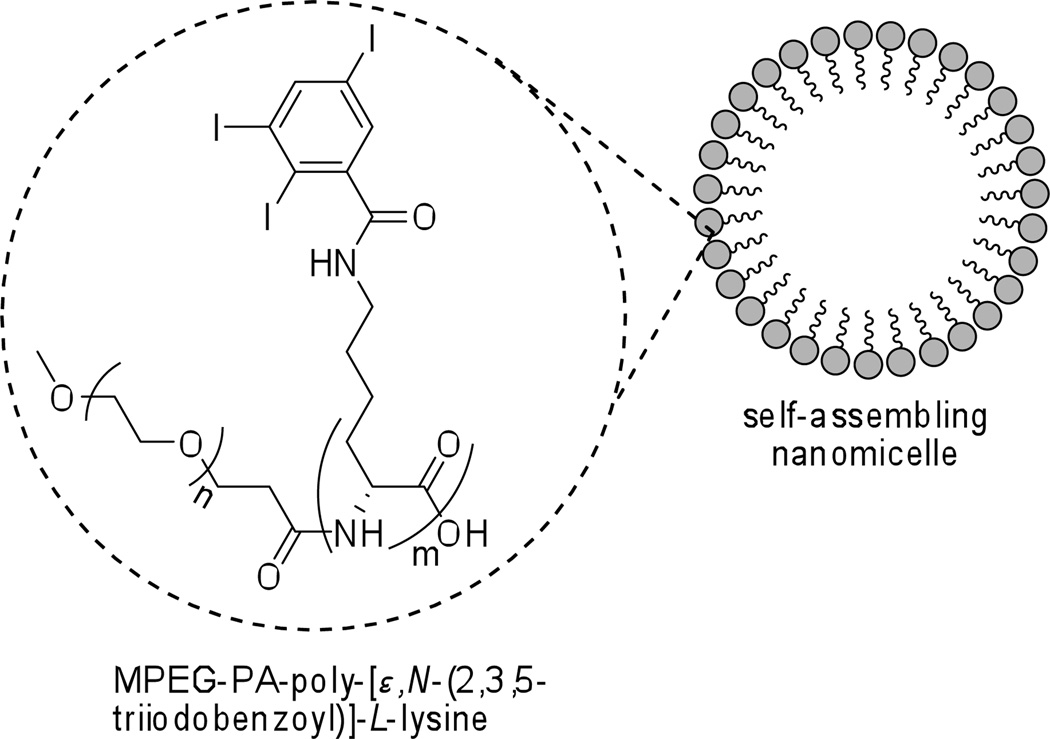
Self-assembling nanomicellar CT contrast agent.
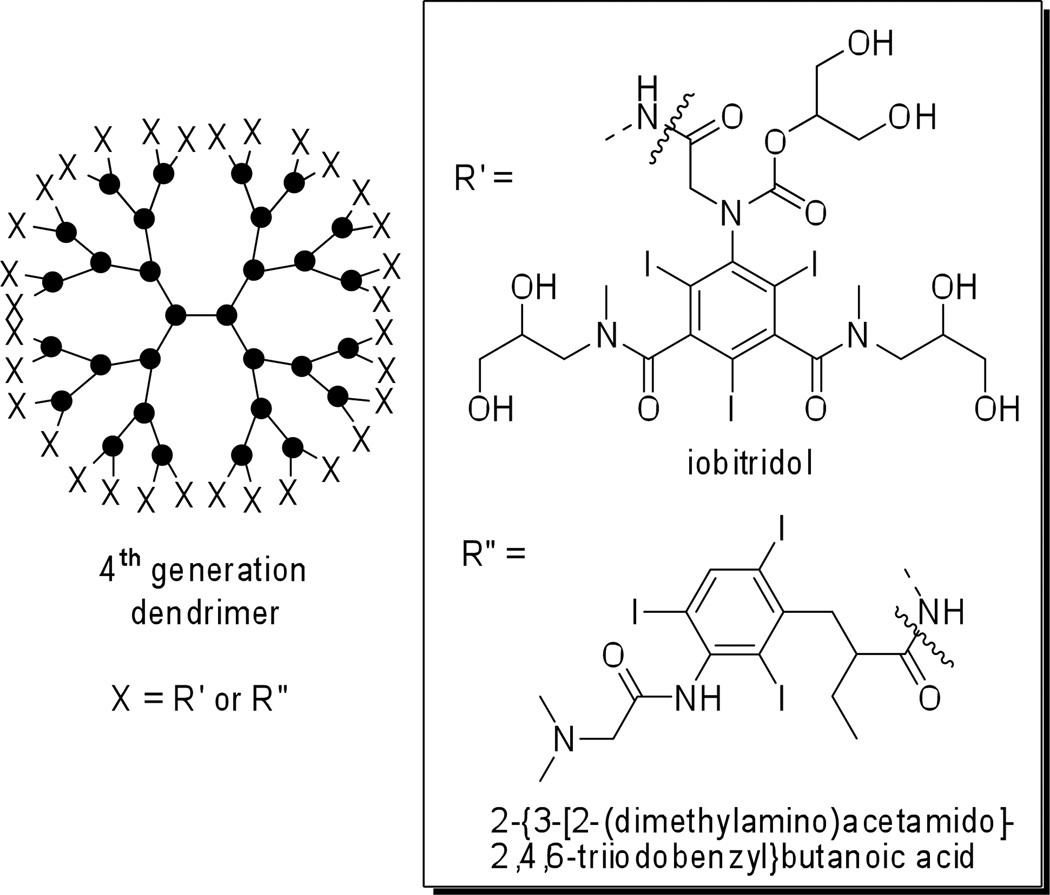
Schematic representation of 4th generation dendrimer contrast agents. X = iobitridol (R') for poly-L-lysine/MPEG bowtie dendrimer; X = 2-{3-[2-(dimethylamino)acetamido]-2,4,6-triiodobenzyl}butanoic acid (R") for the PAMAM dendrimer imaging agent.
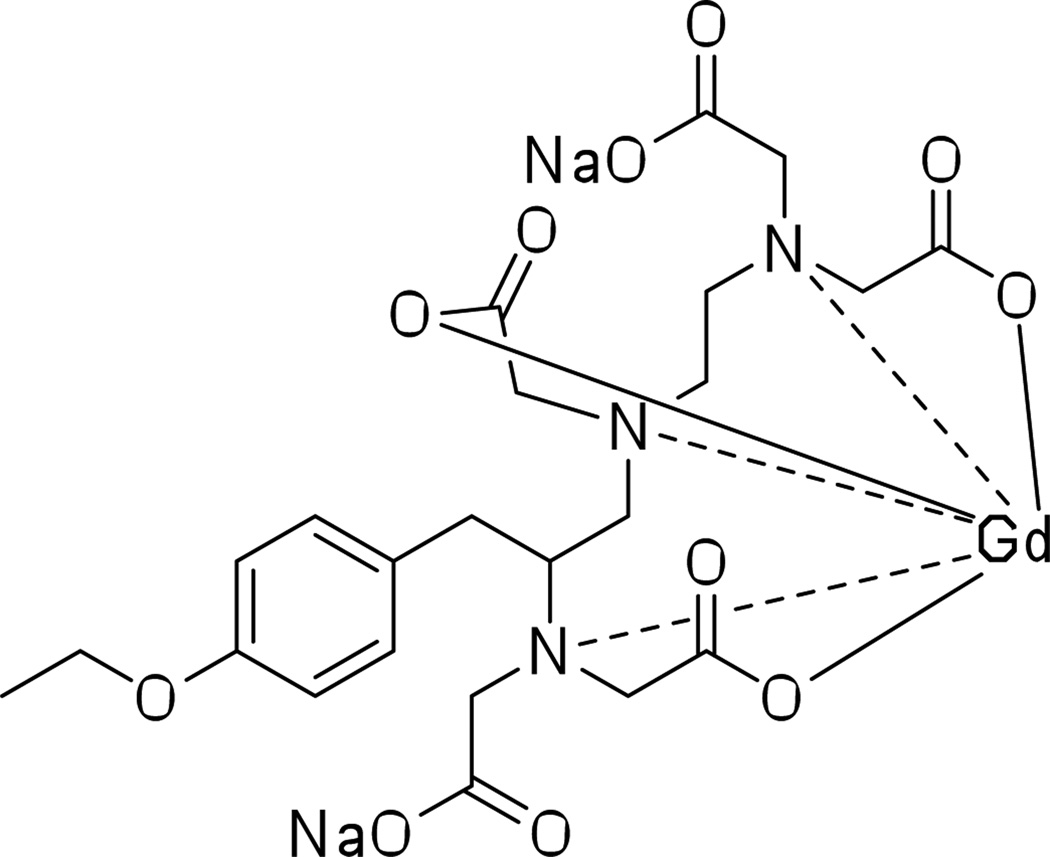
Gadoxetate disodium salt, a clinically approved MRI liver-specific contrast agent.
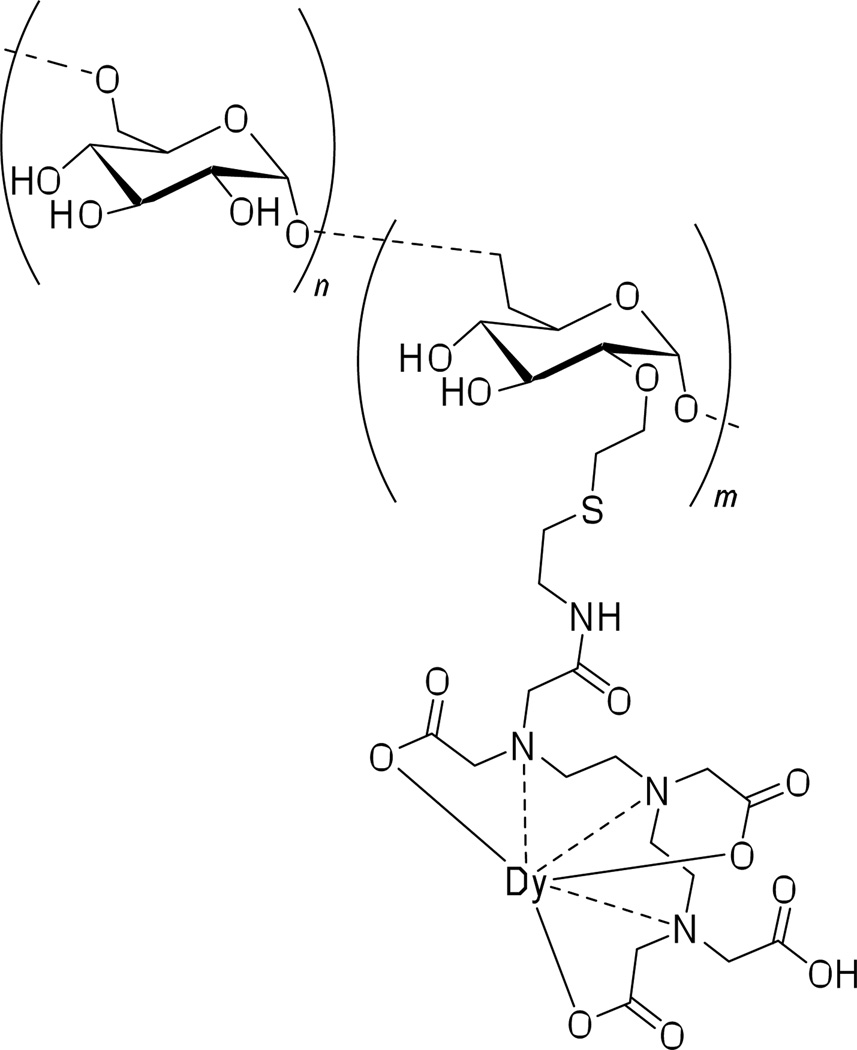
DTPA-conjugated dysprosium chelating dextran polymer for MRI/CT imaging applications.
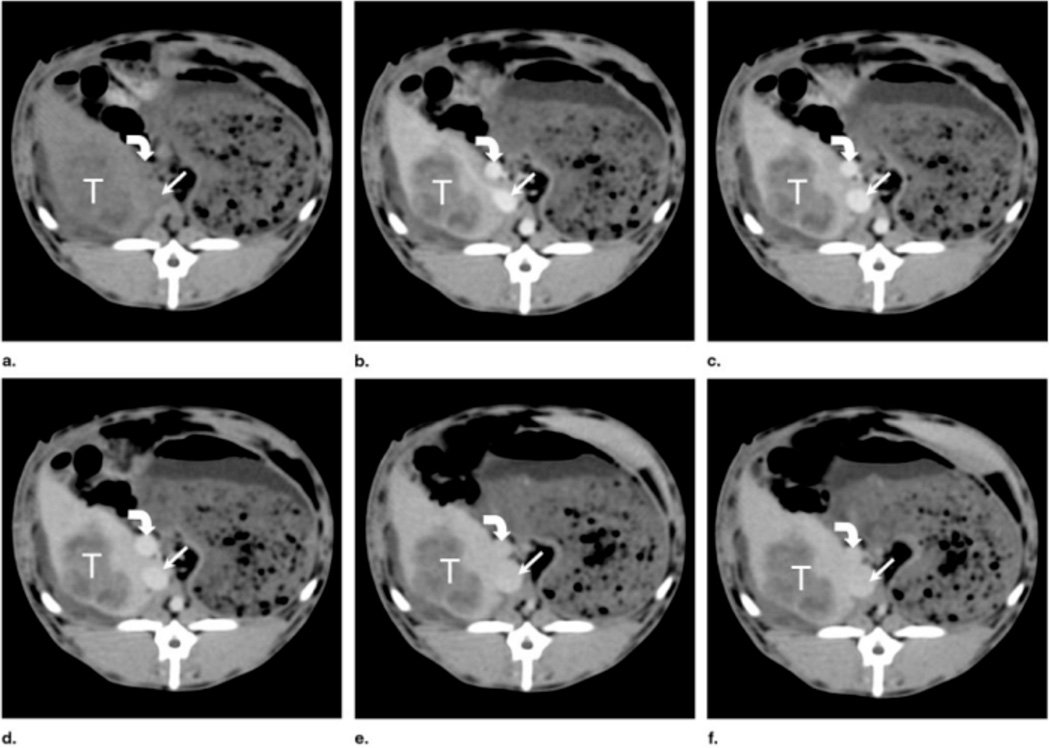
Rabbit with a VX2 tumor (a) before [Dy]DTPA-dextran injection (1.15 mmol of dysprosium per kilogram) and (b) 2, (c) 5, (d) 8, (e) 37, and (f) 45 minutes after injection. The IVC (straight arrow) and portal vein (curved arrow), which were darker than liver before contrast medium enhancement, became and remained brighter than liver after enhancement. Although tumor (T) enhanced slightly as areas of necrosis became more conspicuous, it became much darker than liver after administration of contrast medium, with better-defined margins. (Reprinted with permission from ref. . Copyright 2002 Elsevier Ltd.)
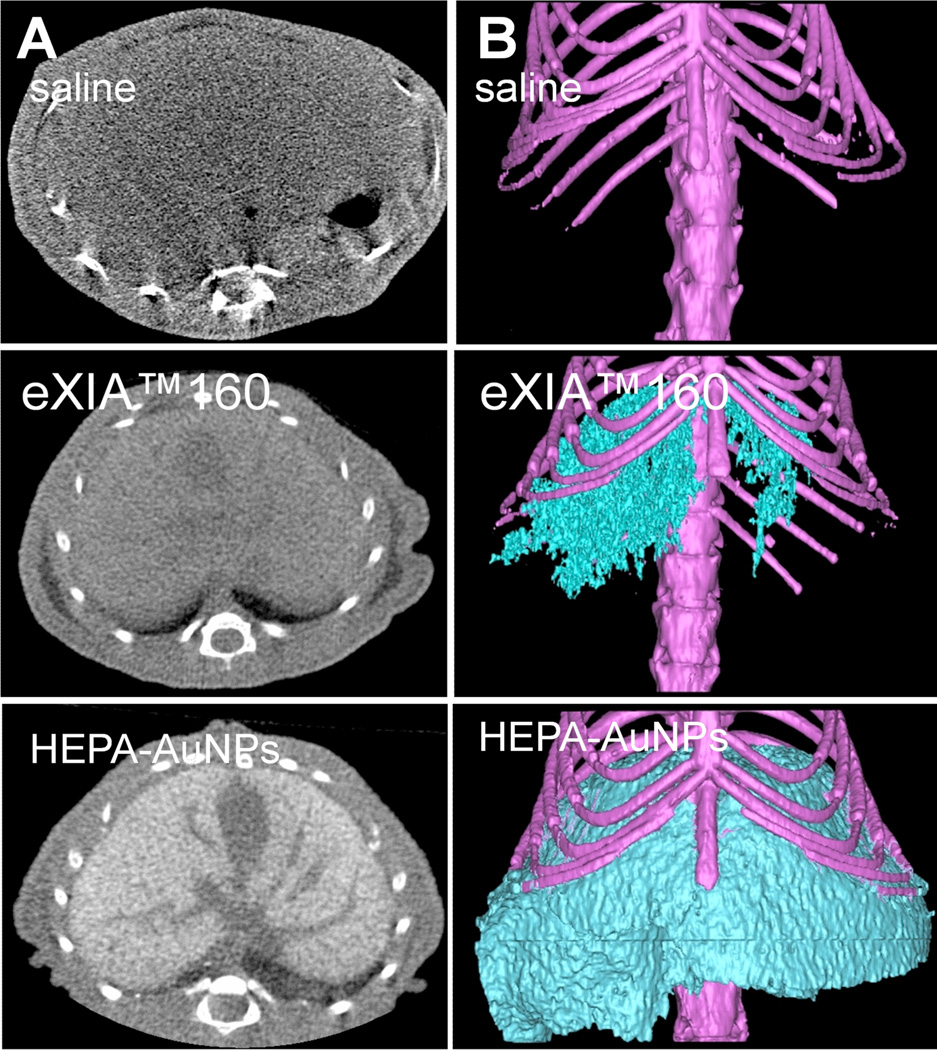
A) Cross-sectional microCT images in livers 2 h post injection of saline, eXIA 160 (800 mg I kg−1), and HEPA-AuNPs (250 mg Au kg−1). B) Three-dimensional microCT images of livers obtained after 2 h post injection of saline, eXIA 160, and HEPA-AuNPs. (Reprinted with permission from ref. . Copyright 2009 John Wiley and Sons.)
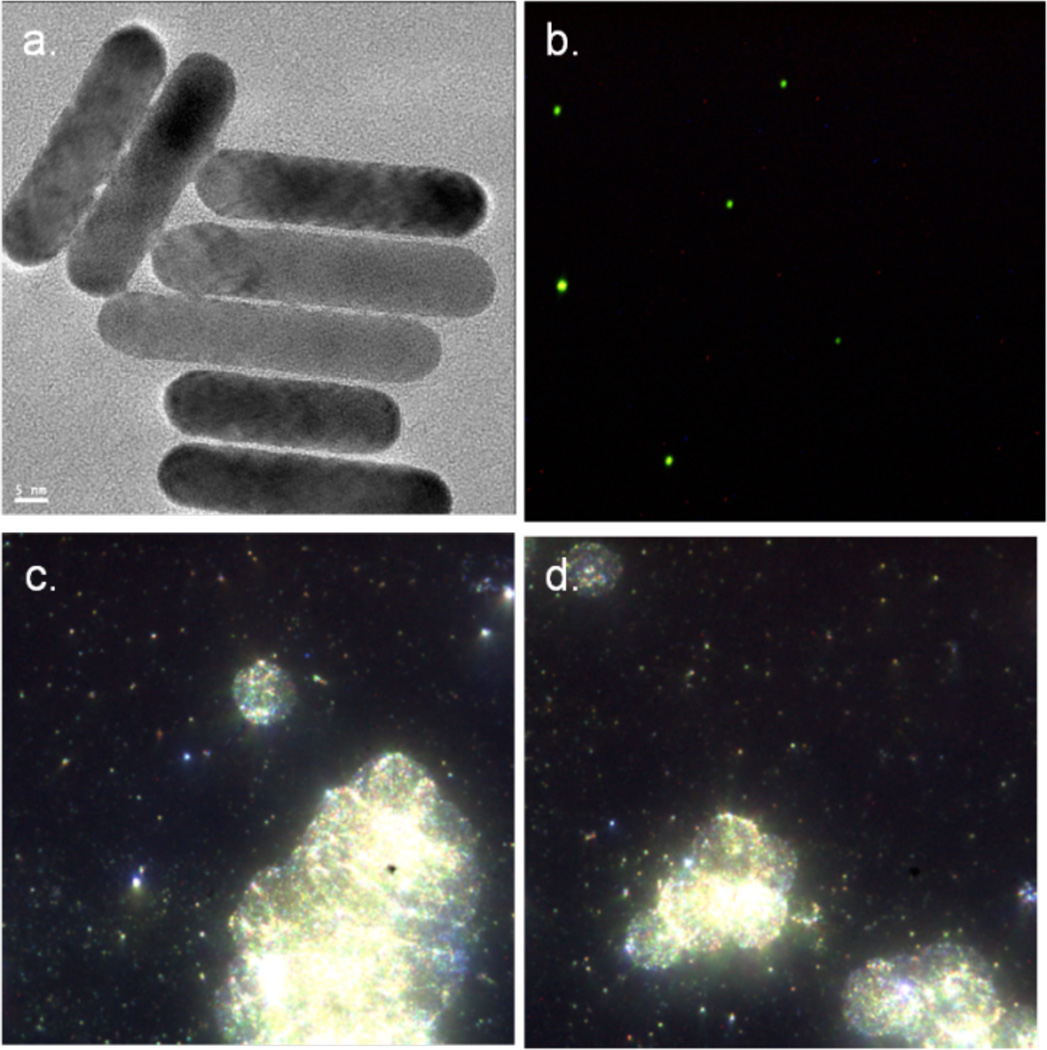
UM-A9 antibody-conjugated AuNP. a) HRTEM image of gold nanorods (scale bar = 5 nm); b) dark-field microscope of gold nanorods; c) and d) in-vitro dark field images of cancer cells targeted with gold nanorods. (Images courtesy of Dr. Rachela Popovtzer, Bar-Ilan University, Israel).
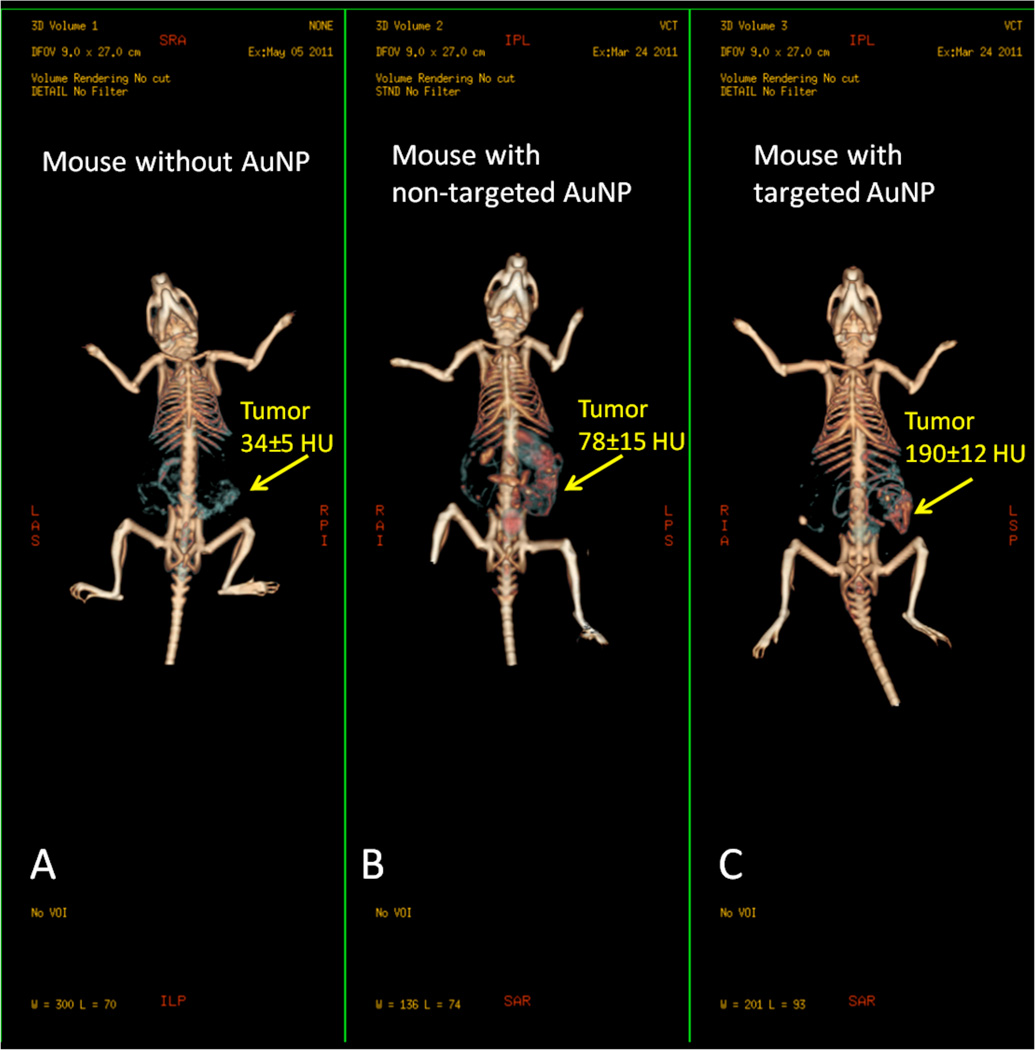
In vivo X-ray computed tomography (CT) volume-rendered images of (A) mouse before injection of gold nanoparticles (AuNPs), (B) mouse 6 hours post-injection of nonspecific immunoglobulin-G AuNPs as a passive targeting experiment, and (C) mouse 6 hours post-injection of anti-epidermal growth factor receptor (EGFR)-coated AuNPs that specifically targeted the squamous cell carcinoma head and neck tumor. The anti-EGFR-targeted AuNPs show clear contrast enhancement of the tumor (C, yellow arrow), which was undetectable without the AuNPs contrast agents (A, yellow arrow). CT numbers represent the average Hounsfield units (HU) of the whole tumor area. All scans were performed using a clinical CT at 80 kVp, 500 mAs, collimation 0.625 × 64 mm and 0.521 pitch size (64 detector CT scanner, LightSpeed VCT; GE Healthcare, Little Chalfont, UK). (Images courtesy of Dr. Rachela Popovtzer, Bar-Ilan University, Israel).
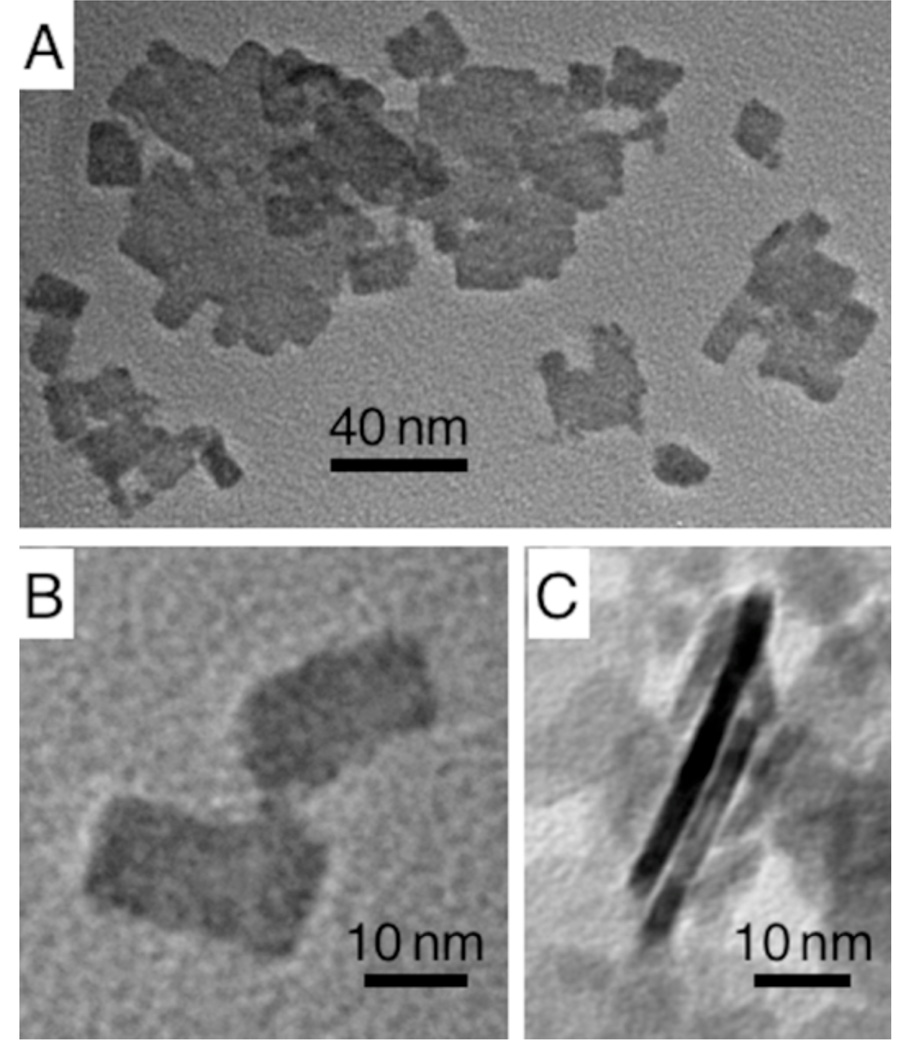
Transmission electron microscopy (TEM) characterization of the Bi2S3 nanoparticles revealed that the nanocrystals had a quasi-rectangular platelet shape, ranging in size from 10 nm to about 50 nm per side, although some larger nanocrystals also had more complex shapes. The thickness of the crystals was 3–4 nm. (Reprinted with permission from ref. . Copyright 2006 Nature Publishing Group.)
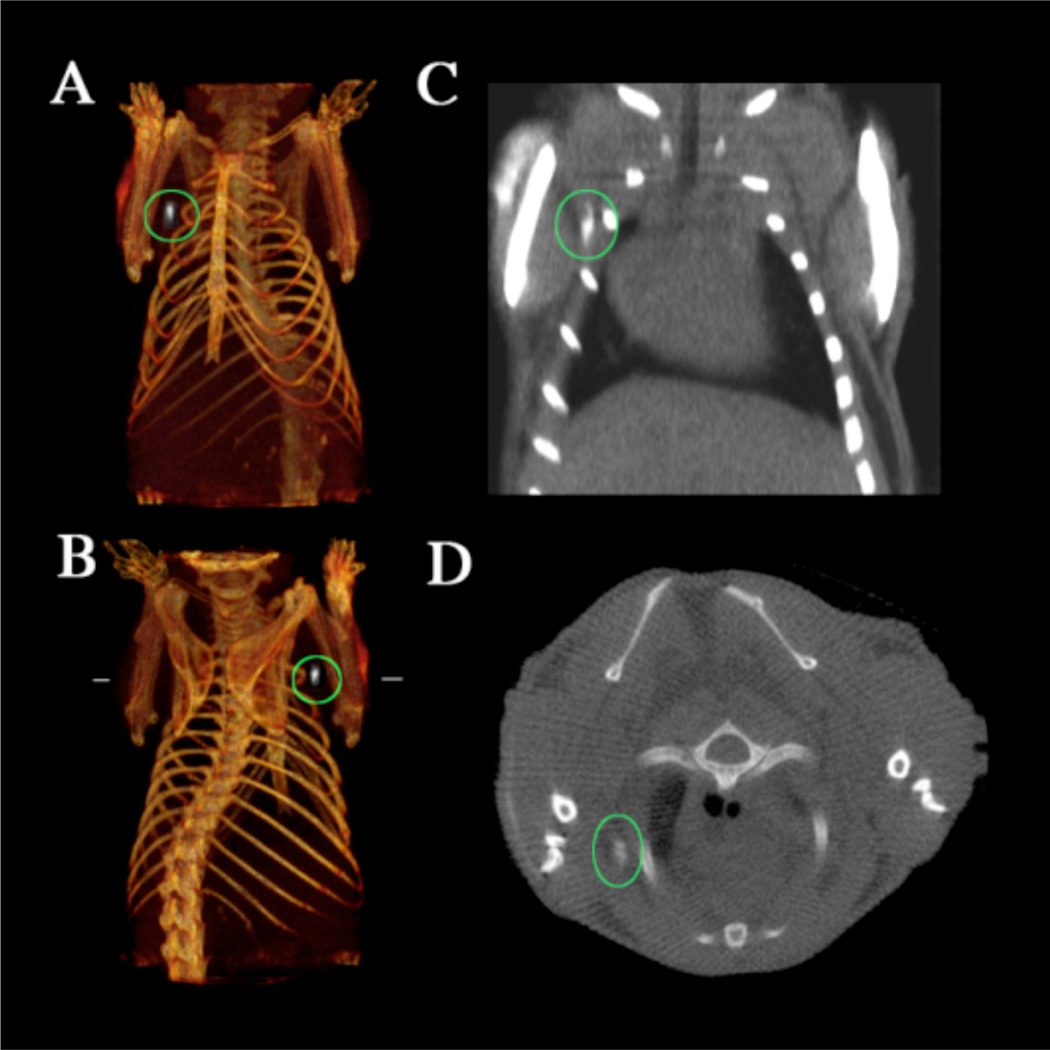
CT imaging of a lymph node of a mouse with the Bi2S3 imaging agent. A) and B) Three-dimensional volume renderings of the CT data set, the length of the reconstruction is 3.8 cm. C) Coronal slice (length of the slice 2.3 cm). D) Transverse slice at the height indicated by the horizontal lines in “B).” The maximal diameter of the mouse 1.8 cm. The position of the lymph node under the right shoulder is indicated by the ovals, and the injection site is shown by the arrows. Note the lack of contrast in the corresponding contra-lateral (left shoulder) lymph node. (Reprinted with permission from ref. . Copyright 2006 Nature Publishing Group.)
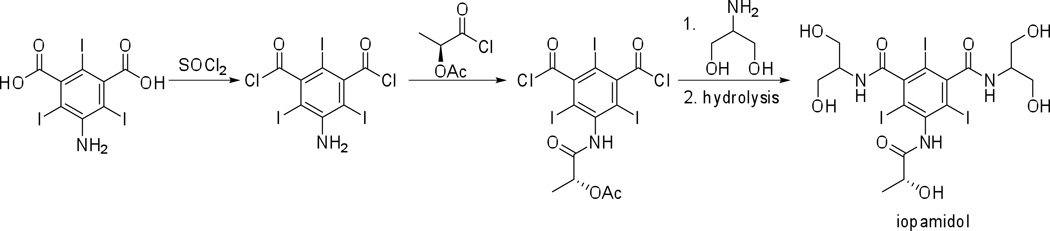
Synthesis of iopamidol from commercially available starting materials on an industrial scale.
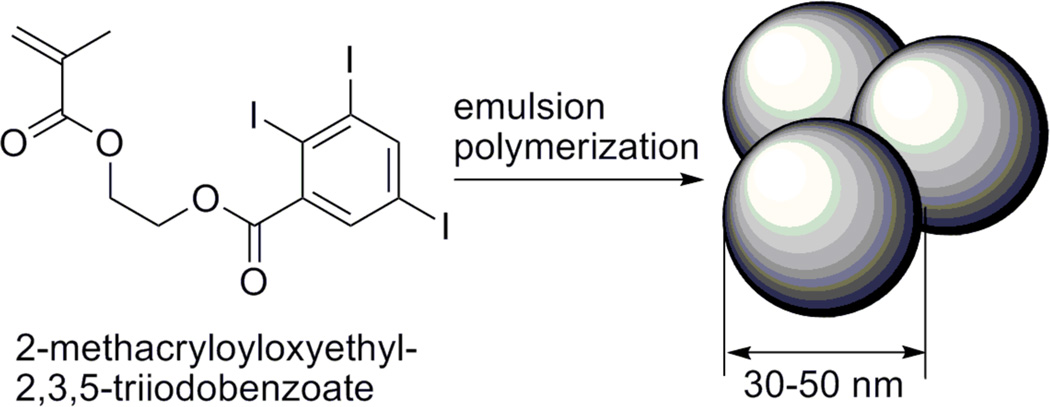
Monomer structure and preparation of MAOETIB nanoparticulate contrast agent.
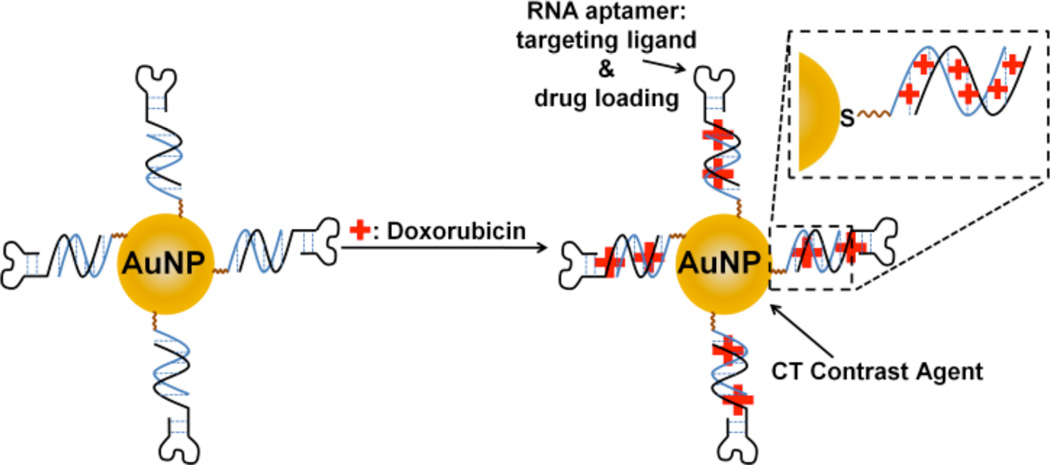
Loading of the trifunctional AuNP with chemotherapeutic drug doxorubicin. The gold center serves as the CT imaging agent, while the RNA aptamer modifications turn the nanoparticle into a targeted drug-delivery vehicle. (Image adapted with permission from ref. . Copyright 2010 American Chemical Society.)
References
-
- Webb WR, Brant W, Major N. Fundamentals of body CT. 3rd ed. Philadelphia, PA: Saunders Elsevier; 2005.
- Kalender WA. Phys. Med. Biol. 2006;51:R29. - PubMed
- Buzug TM. Computed Tomography: From Photon Statistics to Modern Cone-Beam CT. 1st ed. Berlin, Germany: Springer; 2010.
- Badea CT, Drangova M, Holdsworth DW, Johnson GA. Phys. Med. Biol. 2008;53:R319. - PMC - PubMed
- Hielscher AH. Curr. Opin. Biotechnol. 2005;16:79. - PubMed
- Schambach SJ, Bag S, Schilling L, Groden C, Brockmann MA. Methods. 2010;50:2. - PubMed
-
- Tabulation and Graphical Summary of 2000 Survey of Computed Tomography. Conference of Radiation Control Program Directors Inc.; Frankfort, KY. 2007.
-
- Lindsten J, editor. Nobel Lectures: Physiology or Medicine 1971–1980. Vol. 1. Singapore: World Scientific Publishing Co.; 1992.
-
- Kalender WA. Computed Tomography: Fundamentals, System Technology, Image Quality, Applications. 3rd ed. Munich, Germany: Publicis; 2011.
- Romans LE. Computed Tomography for Technologists: A Comprehensive Text. 1st ed. Baltimore, MD: Lippincott Williams & Wilkins; 2010.
- Seeram E. Computed Tomography: Physical Principles, Clinical Applications, and Quality Control. 3rd ed. St. Louis, MO: Saunders Elsevier; 2009.
- Hsieh J. Computed Tomography: Principles, Design, Artifacts, and Recent Advances. 2nd ed. Bellingham, WA: SPIE Publications; 2009.
- Figueiredo G, Brockmann C, Boll H, Heilmann M, Schambach SJ, Fiebig T, Kramer M, Groden C, Brockmann MA. Clin. Neuroradiol. 2012;22:21. - PubMed
- Figueiredo G, Boll H, Kramer M, Groden C, Brockmann MA. Am. J. Neuroradiol. 2012;33 In Press. - PMC - PubMed
Publication types
MeSH terms
Substances
Grants and funding
LinkOut - more resources
Full Text Sources
Other Literature Sources
