. 2013 Feb 15;304(4):E352-62.
doi: 10.1152/ajpendo.00377.2012. Epub 2012 Dec 4.

Increased amino acid supply potentiates glucose-stimulated insulin secretion but does not increase β-cell mass in fetal sheep

Affiliations

Increased amino acid supply potentiates glucose-stimulated insulin secretion but does not increase β-cell mass in fetal sheep

Monika M Gadhia et al. Am J Physiol Endocrinol Metab. .

Abstract

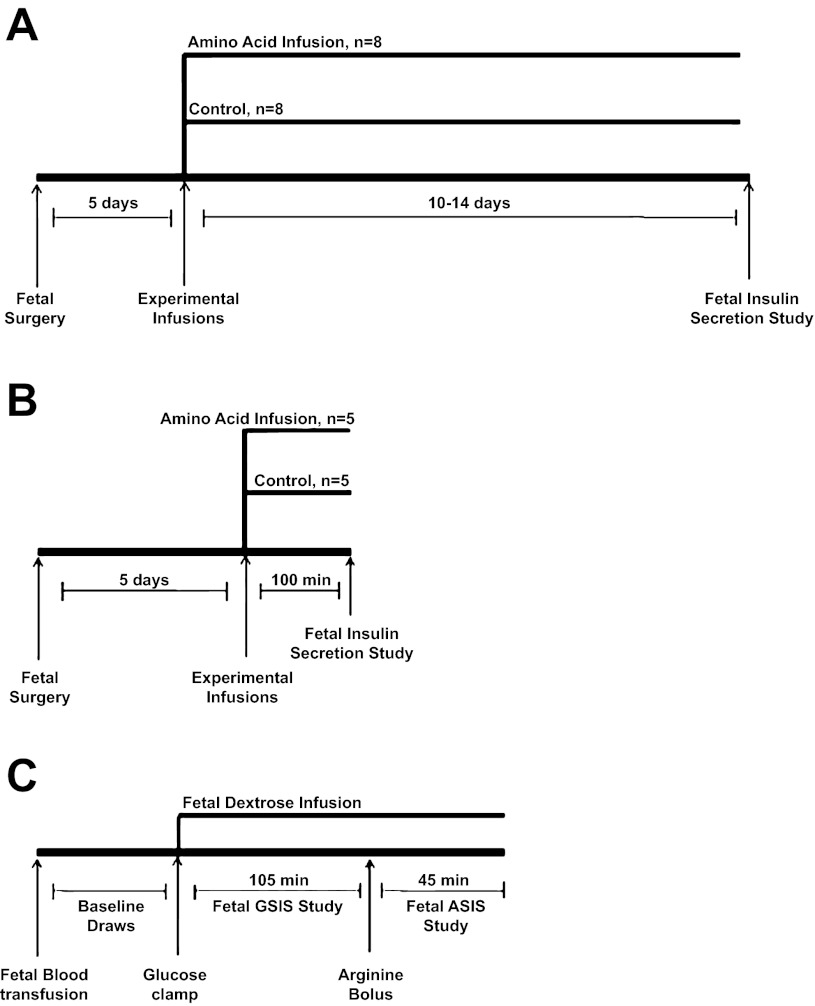
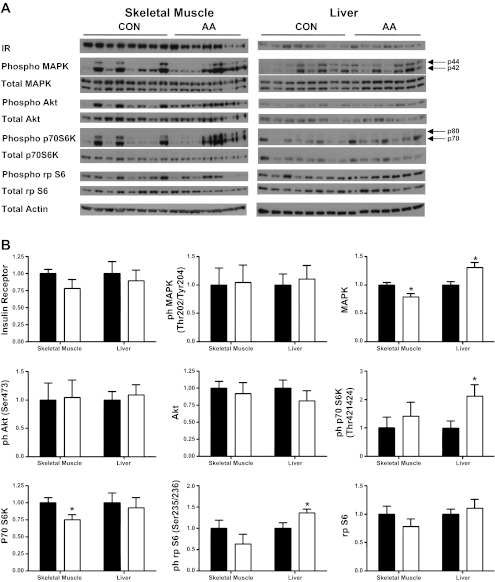
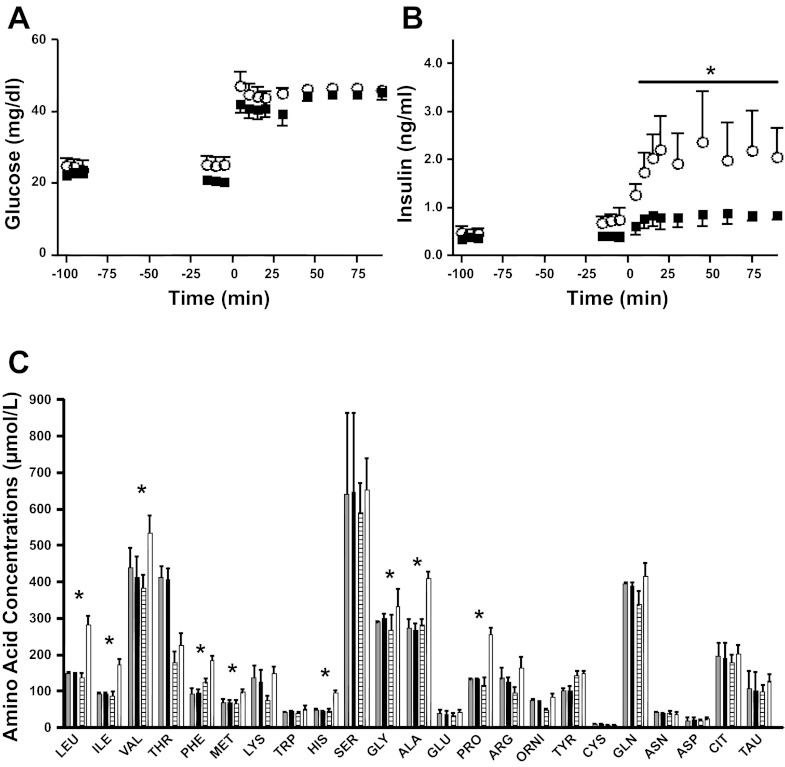
Amino acids and glucose acutely stimulate fetal insulin secretion. In isolated adult pancreatic islets, amino acids potentiate glucose-stimulated insulin secretion (GSIS), but whether amino acids have this same effect in the fetus is unknown. Therefore, we tested the effects of increased fetal amino acid supply on GSIS and morphology of the pancreas. We hypothesized that increasing fetal amino acid supply would potentiate GSIS. Singleton fetal sheep received a direct intravenous infusion of an amino acid mixture (AA) or saline (CON) for 10-14 days during late gestation to target a 25-50% increase in fetal branched-chain amino acids (BCAA). Early-phase GSIS increased 150% in the AA group (P < 0.01), and this difference was sustained for the duration of the hyperglycemic clamp (105 min) (P < 0.05). Glucose-potentiated arginine-stimulated insulin secretion (ASIS), pancreatic insulin content, and pancreatic glucagon content were similar between groups. β-Cell mass and area were unchanged between groups. Baseline and arginine-stimulated glucagon concentrations were increased in the AA group (P < 0.05). Pancreatic α-cell mass and area were unchanged. Fetal and pancreatic weights were similar. We conclude that a sustained increase of amino acid supply to the normally growing late-gestation fetus potentiated fetal GSIS but did not affect the morphology or insulin content of the pancreas. We speculate that increased β-cell responsiveness (insulin secretion) following increased amino acid supply may be due to increased generation of secondary messengers in the β-cell. This may be enhanced by the paracrine action of glucagon on the β-cell.


Figures

Fig. 1.
Fig. 1.
Study diagrams. Diagrams for the chronic 10- to 14-day experiment (A), the acute 3-h experiment (B), and the fetal insulin secretion study (C). The insulin secretion study in the acute 3-h experiment was terminated after minute 90 and did not include an arginine infusion. GSIS, glucose-stimulated insulin secretion; ASIS, arginine-stimulated insulin secretion.
Fig. 2.
Fig. 2.
Maternal arterial amino acid (AA) concentrations in the chronic AA study. Gray bars represent baseline maternal saline (CON; n = 8) AA concentrations, and black bars represent the average maternal CON AA concentrations from day 8 and the final day of the experimental infusion. White striped bars represent baseline maternal AA concentrations (n = 8), and open bars represent the average maternal AA concentrations from day 8 and the final day of the experimental infusion. Values expressed as means ± SE. *Significant increase in AA concentrations during the experimental infusion (P < 0.05).
Fig. 3.
Fig. 3.
Fetal arterial AA concentrations in the chronic AA study. Gray bars represent baseline CON (n = 8) AA concentrations, and black bars represent the CON average AA concentrations throughout the experimental infusion beginning on day 2. White striped bars represent baseline AA concentrations (n = 8), and open bars represent the average AA concentrations throughout the experimental infusion beginning on day 2. Values expressed as means ± SE. *Significant increase in AA concentrations during the experimental infusion (P < 0.05). Glutamine concentrations increased significantly (P < 0.05) on day 2 in the AA group and then returned to baseline.
Fig. 4.
Fig. 4.
Fetal arterial glucose, lactate, and insulin concentrations in the chronic AA study. Glucose (A), lactate (B), and insulin (C) concentrations were measured throughout the chronic AA study. ■, CON group (n = 8); ○, AA group (n = 8). All values expressed as means ± SE. *Significant difference between groups (P < 0.05); #significant decrease in glucose concentrations during the experimental infusion in the AA group only (P < 0.05).
Fig. 5.
Fig. 5.
Fetal arterial GSIS glucose and insulin concentrations following the chronic AA infusion. A square-wave hyperglycemic clamp was initiated at minute 0 and titrated to achieve a 2-fold increase in glucose concentrations from baseline in both groups. Glucose (A) and insulin (B) were measured throughout. ■, CON group (n = 8); ○, AA group (n = 7). Values are means ± SE. *P < 0.01.
Fig. 6.
Fig. 6.
Glucose-stimulated insulin concentrations as a function of insulin sensitivity. Steady-state hyperglycemic clamp insulin concentrations (the average insulin concentration between minutes 60 and 105 of the hyperglycemic clamp) from CON (n = 8; ■) and AA (n = 8; ○) are plotted as a function of the inverse of the product of basal insulin and glucose concentrations [1/(insulinbasal) × (glucosebasal)], an estimate of insulin sensitivity. Also plotted are means (black line) ± SE (shaded gray area) from a group of normal late-gestation fetuses; n = 43.
Fig. 7.
Fig. 7.
Insulin receptor and insulin-responsive proteins in fetal skeletal muscle and liver. A: Western blot analysis of protein expression of the insulin receptor and the total and phosphorylated (phospho) mitogen-activated protein kinase (MAPK), Akt, p70 S6 protein kinase (p70 S6K), ribosomal protein S6 (rp S6), and actin from CON (n = 8) and AA (n = 7) fetal skeletal muscle and liver. B: quantification of the Western blot analysis relative to actin. Values are means ± SE and are expressed relative to CON. *P < 0.05.
Fig. 8.
Fig. 8.
Acute AA-potentiated fetal GSIS. A square-wave hyperglycemic clamp was initiated at minute 0 and titrated to achieve a 2-fold increase in glucose concentrations from baseline in both groups. Glucose (A) and insulin (B) were measured throughout. ■, CON group (n = 5); ○, AA group (n = 5). C: gray bars represent baseline CON AA concentrations, and black bars represent the CON AA concentrations at initiation of the hyperglycemic clamp. White striped bars represent baseline AA concentrations, and open bars represent the AA concentrations at initiation of the hyperglycemic clamp. Values are means ± SE. *P < 0.05.

References

    1. Ahren B, Pacini G. Islet adaptation to insulin resistance: mechanisms and implications for intervention. Diabetes Obes Metab 7: 2–8, 2005 - PubMed
    1. Beckett PR, Hardin DS, Davis TA, Nguyen HV, Wray-Cahen D, Copeland KC. Spectrophometric assay for measuring branched-chain amino acid concentrations: application for measuring the sensitivity of protein metabolism to insulin. Anal Biochem 240: 48–53, 1996 - PubMed
    1. Blommaart EF, Luiken JJ, Blommaart PJ, van Woerkom GM, Meijer AJ. Phosphorylation of ribosomal protein S6 is inhibitory for autophagy in isolated rat hepatocytes. J Biol Chem 270: 2320–2326, 1995 - PubMed
    1. Boujendar S, Arany E, Hill D, Remacle C, Reusens B. Taurine supplementation of a low protein diet fed to rat dams normalizes the vascularization of the fetal endocrine pancreas. J Nutr 133: 2820–2825, 2003 - PubMed
    1. Boujendar S, Reusens B, Merezak S, Ahn MT, Arany E, Hill D, Remacle C. Taurine supplementation to a low protein diet during foetal and early postnatal life restores a normal proliferation and apoptosis of rat pancreatic islets. Diabetologia 45: 856–866, 2002 - PubMed

Publication types

MeSH terms

LinkOut - more resources