. 2013 Jan;36(1):41-51.
doi: 10.1097/CJI.0b013e318274590e.

Examining T cells at vaccine sites of tumor-bearing hosts provides insights to dysfunctional T-cell immunity

Affiliations

Examining T cells at vaccine sites of tumor-bearing hosts provides insights to dysfunctional T-cell immunity

Kristen M Barr et al. J Immunother. 2013 Jan.

Abstract

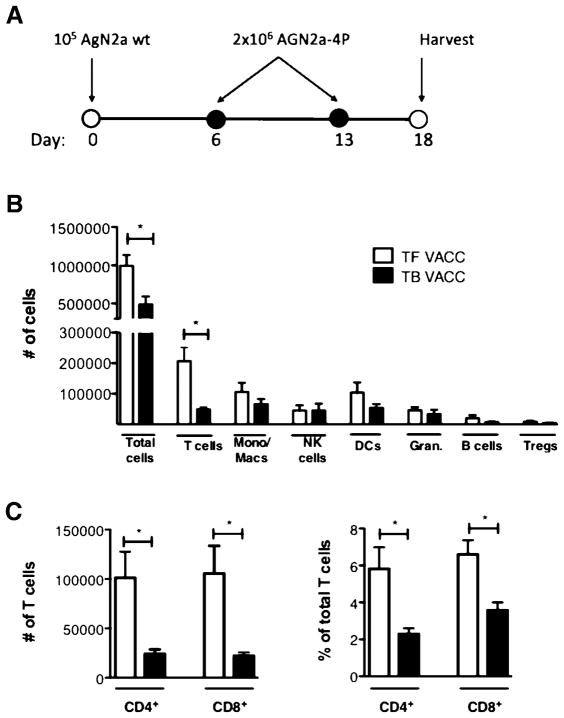
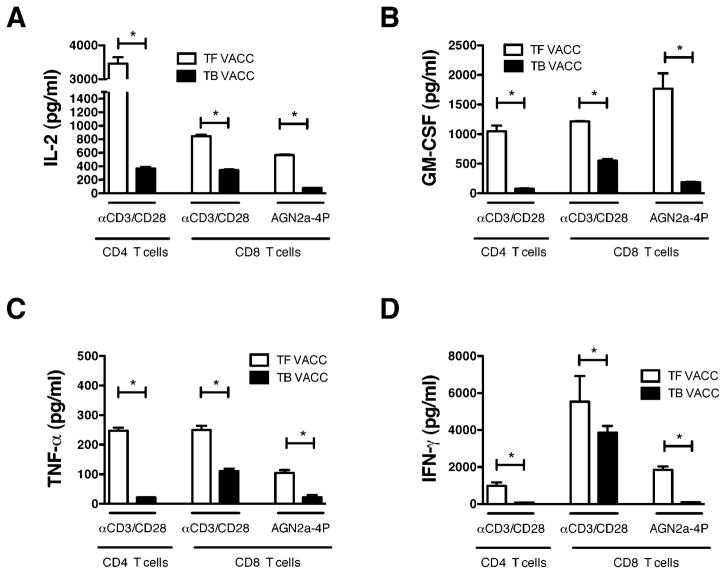
When tumor vaccines are administered as cancer immunotherapy, cellular interactions at the vaccine site are crucial to the generation of antitumor immunity. Examining interactions at the vaccine site could provide important insights to the success or failure of vaccination. Our laboratory previously showed that while administration of a cell-based vaccine to tumor-free mice leads to productive antineuroblastoma immunity, vaccination of tumor-bearing mice does not. The goal of this study was to examine immune effectors at the vaccine site to identify mechanisms responsible for the generation of ineffective antitumor immunity in tumor-bearing mice. The results of this study show that vaccine sites of tumor-bearing mice contained significantly fewer T cells than vaccine sites of tumor-free mice. Similar migration and proliferation of T cells was observed in the vaccine sites of tumor-bearing and tumor-free mice, but T cells in the sites of tumor-bearing mice were more apoptotic. T cells at the vaccine sites of both tumor-free and tumor-bearing mice had an effector-memory phenotype and expressed activation markers. Despite the activated phenotype, T cells from tumor-bearing mice elicited defective antitumor immune responses. Although T cells from vaccine sites of tumor-bearing mice were capable of producing inflammatory cytokines, the T cells from tumor-bearing mice produced lower levels of cytokines compared with T cells from the tumor-free mice. Remarkably, this defect seems to be systemic, affecting distal T cells in tumor-bearing mice. This study demonstrates that the defective vaccine-induced immune response to neuroblastoma in tumor-bearing hosts originates as a result of tumor burden, resulting in poor antitumor immunity.


Figures

Figure 1
Figure 1. Phenotype of immune cells infiltrating the vaccine sites of tumor-bearing and tumor-free mice
(A) Experimental timeline: Tumors were established in the right hind flank of A/J mice by subcutaneous injection of 105 AGN2a wild-type cells on day 0. On day 6, mice received 2×10⁶ AGN2a-4P vaccine cells suspended in PBS. On day 13, mice received 2×10⁶ AGN2a-4P vaccine cells embedded in matrigel. On day 18, spleen, lymph nodes, and matrigel plugs were processed for analysis. (B) Absolute numbers of infiltrating T cells (7AADCD45+CD3+CD4/8+) B cells (7AADCD45+CD3B220+), monocytes/macrophages (7AADCD45+CD3F4/80+), DCs (7AADCD45+CD11c+I-Ak+), NK cells (7AADCD45+CD3CD335+), and Tregs (7AADCD45+CD3+CD4+CD8Foxp3+). (C) Absolute numbers (left) and percentages (right) of CD4 T cells (7AADCD45+CD3+CD4+CD8) and CD8T cells (7AADCD45+CD3+CD4CD8+) captured in matrigel plugs and harvested 5 days after the second immunization. (B & C) White bars represent vaccinated tumor-free treatment groups (TF VACC). Gray bars represent vaccinated tumor-bearing treatment groups (TB VACC). Values plotted are the average number obtained from three separate experiments. Each experiment includes at least 3 mice from each treatment group. *p-value < 0.01
Figure 2
Figure 2. A decrease in the number of T cells at tumor-bearing vaccine sites is detected five days after the second vaccination
(A) Experimental timeline: Tumors were established in A/J mice by subcutaneous injection of 105 AGN2a cells on day 0. On day 6, mice were injected with 2×10⁶ irradiated AGN2a-4P vaccine cells in PBS. On day 13, mice received 2×10⁶ irradiated AGN2a-4P vaccine cells embedded in matrigel. Spleens, lymph nodes, and matrigel plugs were processed for analysis on days 14, 16, 18, and 20. (B) Absolute numbers of CD4 T cells (7AADCD45+CD3+CD4+CD8) and CD8 T cells (7AADCD45+CD3+CD4CD8+) from matrigel plugs harvested on days 14, 16, and 18. (C) Total numbers of cells harvested from vaccine sites on days 14, 16, 18, or 20. (B and C) White bars represent TF VACC groups and gray bars represent TB VACC groups. Data is representative of three separate experiments. *p-value < 0.01
Figure 3
Figure 3. Decreased numbers of T cells in vaccine sites of tumor-bearing hosts appear to be due to increased apoptosis
A/J mice were inoculated subcutaneously with 105 viable AGN2a cells on day 0. Identical to the timeline in Figure 2, mice received two vaccines containing 2×10⁶ irradiated AGN2a-4P cells, the first in PBS and the second embedded in matrigel. Percentages of CD4 and CD8 T cells that were caspase3+ and 7AAD were determined by flow cytometry. (A) Combined data showing the percentages of Ki-67+ CD4 and CD8 T cells from matrigel plugs as determined by flow cytometry. White bars represent tumor-free treatment groups. Gray bars represent tumor-bearing treatment groups. The results are the combined data from three separate experiments (at least 3 mice per group). (B) Representative flow cytometric plots of CD8 T cells that were caspase3+ from the TF VACC group, TB VACC group, and a serum-starved control group. The top panels show control FMO staining that was used for gating. The bottom panels show that CD8 T cells that were caspase3+. (C and D) Combined data showing the percentages of caspase3+ CD4 and CD8 T cells harvested from the spleens and vaccine sites of tumor-free and tumor-bearing mice on day 16 and day 18. *p-value < 0.01
Figure 4
Figure 4. The majority of T cells at vaccine sites of both tumor-free and tumor-bearing mice express activation markers and have a TEM phenotype
The experimental design in Figure 1 was used for these experiments. (A) Representative flow cytometric plots showing CD44 and CD62L expression on CD8 T cells from the spleens (top row) and vaccine sites (bottom row) in tumor-free and tumor-bearing mice. (B) The percentages of CD44lo/CD62Lhi, CD44hi/CD62Lhi, and CD44hi/CD62Llo CD8 T cells in the spleens (left) and vaccine sites (right) from TF VACC (white bars) and TB VACC (gray bars) are depicted. (C) The percentages of PD1+, CD25+, CD69+ and CD49b+ CD8 T cells from the vaccine sites of TF VACC (white bars) and TB VACC (gray bars) mice are shown. The T cell populations analyzed were pre-gated on 7AADCD45+CD3+ cells. The data is representative of three separate experiments. *p-value < 0.01
Figure 5
Figure 5. Decreased cytokine production by T cells from the vaccine sites of tumor-bearing mice
The experimental timeline from Figure 1A was used for these experiments. On day 18, CD4 and CD8T cells were isolated from spleens for Bio-Plex cytokine analysis. T cells were co-cultured overnight either with αCD3/αCD28 beads or AGN2a-4P cells (CD8 T cells only). After 24 hours, culture supernatants were collected to determine concentrations of (A) IL-2, (B) GM-CSF, (C) TNF-α, and (D) IFN-γ. Data from one of two independent experiments is shown, where the T cells are pooled from at least 5 mice. White bars represent TF VACC and gray bars represent TB VACC treatment groups. *p-value < 0.01
Figure 6
Figure 6. CD8 T cells from the vaccine sites of tumor-bearing mice produce decreased amounts of IFN–γ
The experimental timeline from Figure 1 was used for these experiments. On day 18 (5 days after the second vaccine), CD8 T cells from spleens and vaccine sites were isolated and tested for IFN-γ production in ELISPOT assays. For the assay, either (A) live AGN2a-4P cells or (B) αCD3/αCD28 beads were used to stimulate the CD8 T cells overnight in culture. Results are shown from one of 3 independent experiments, where the CD8 T cells were pooled from at least 5 mice. White bars represent TF VACC treatment groups, and gray bars represent TB VACC treatment groups. *p-value < 0.01
Figure 7
Figure 7. Established tumor globally inhibits the activation of antigen-reactive CD8 T cells
(A) The experimental timeline from Figure 1 was used for these experiments. AGN2a tumor was inoculated in both the right and left hind flanks to produce tumor-bearing mice. In all mice, the AGN2a-4P vaccine was injected subcutaneously in the left shoulder, and a “vaccine” consisting of irradiated allogeneic FVB splenocytes was administered subcutaneously in the right shoulder. On day 18, CD8 T cells from the spleen and each of the matrigel plugs were isolated for analysis. (B) Absolute numbers of CD4 andCD8 T cells isolated from the AGN2a-4P and FVB (allogeneic) vaccine matrigel plugs of the tumor-free vaccinated mice (open squares) and tumor-bearing vaccinated mice (enclosed circles) were determined. (C) CD8 T cells isolated from the allogeneic vaccine matrigel plugs were tested in IFN-γ ELISPOT assays after overnight stimulation with FVB (allogeneic) splenocytes.

Similar articles

Cited by

References

    1. Esiashvili N, Anderson C, Katzenstein HM. Neuroblastoma. Curr Probl Cancer. 2009;33:333–360. - PubMed
    1. Smith MA, Seibel NL, Altekruse SF, et al. Outcomes for children and adolescents with cancer: challenges for the twenty-first century. J Clin Oncol. 28:2625–2634. - PMC - PubMed
    1. Brodeur GM, Pritchard J, Berthold F, et al. Revisions of the international criteria for neuroblastoma diagnosis, staging, and response to treatment. J Clin Oncol. 1993;11:1466–1477. - PubMed
    1. Maris JM. Recent advances in neuroblastoma. N Engl J Med. 2010;362:2202–2211. - PMC - PubMed
    1. Maris JM, Hogarty MD, Bagatell R, Cohn SL. Neuroblastoma. Lancet. 2007;369:2106–2120. - PubMed

Publication types