. 2013 Jan 23;32(2):260-74.
doi: 10.1038/emboj.2012.310. Epub 2012 Dec 4.

SCF(TIR1/AFB)-auxin signalling regulates PIN vacuolar trafficking and auxin fluxes during root gravitropism

Affiliations

SCF(TIR1/AFB)-auxin signalling regulates PIN vacuolar trafficking and auxin fluxes during root gravitropism

Paweł Baster et al. EMBO J. .

Abstract

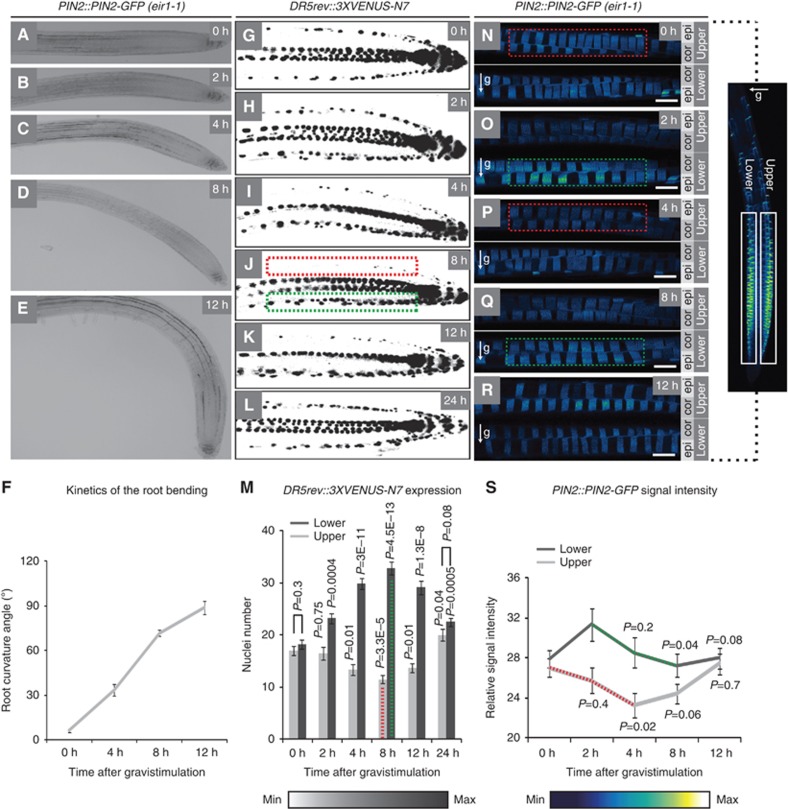
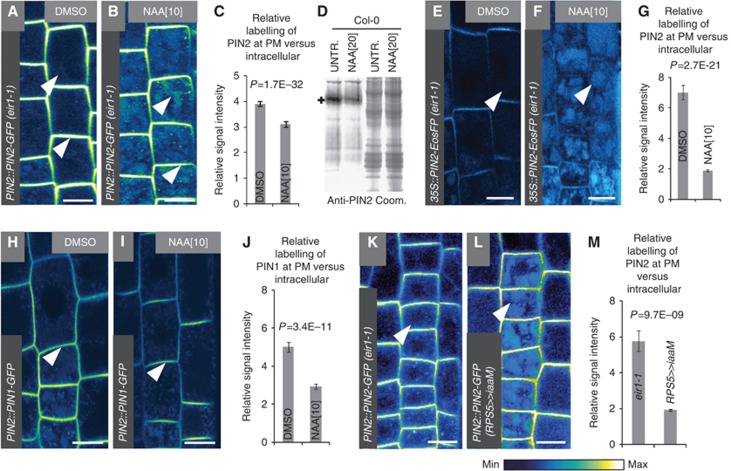
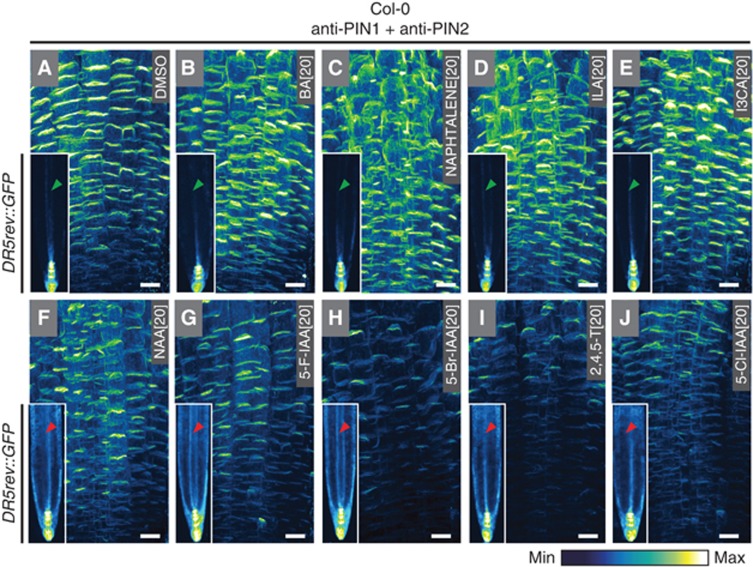
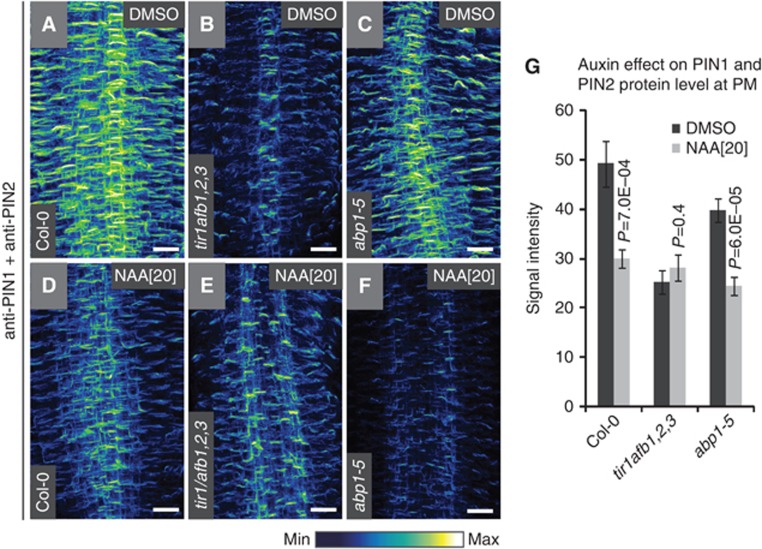
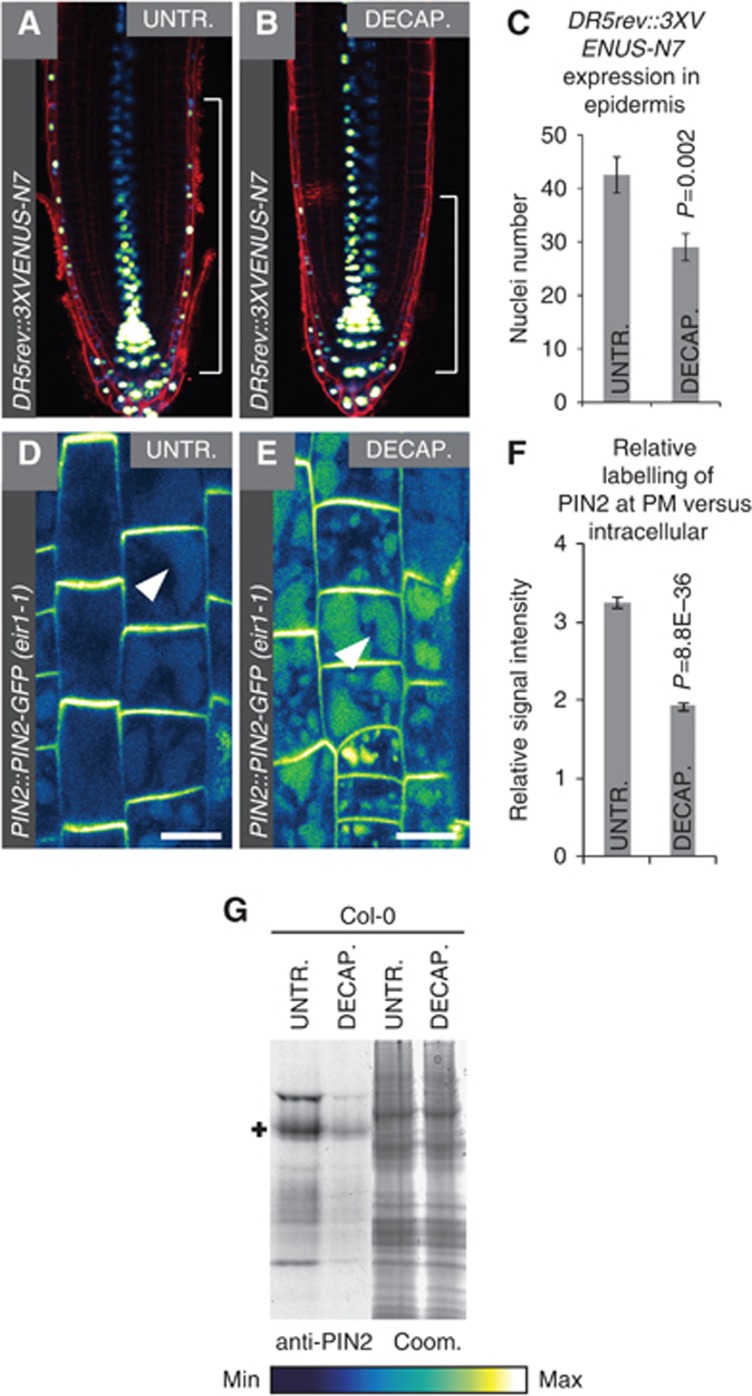
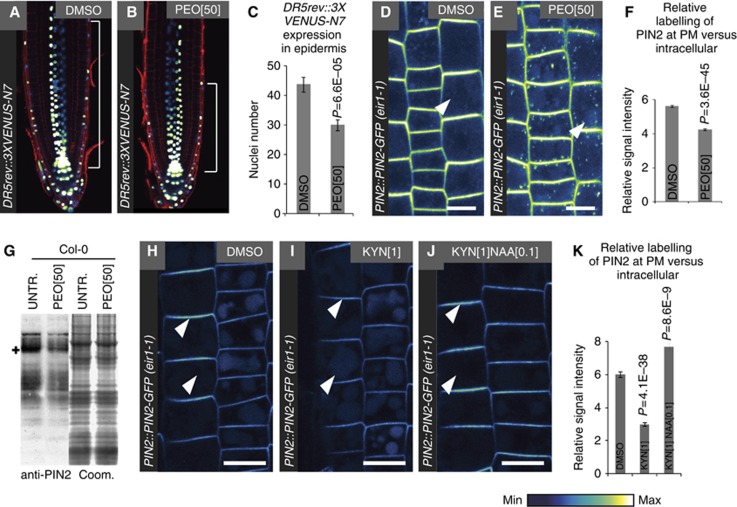
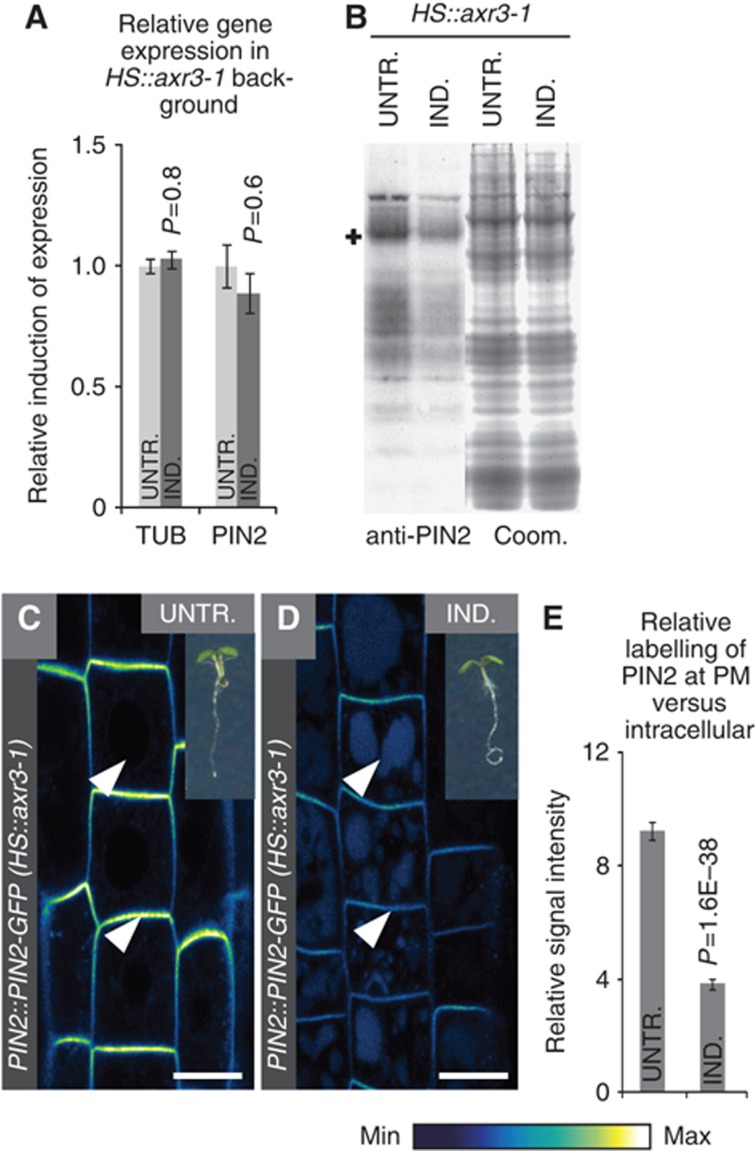
The distribution of the phytohormone auxin regulates many aspects of plant development including growth response to gravity. Gravitropic root curvature involves coordinated and asymmetric cell elongation between the lower and upper side of the root, mediated by differential cellular auxin levels. The asymmetry in the auxin distribution is established and maintained by a spatio-temporal regulation of the PIN-FORMED (PIN) auxin transporter activity. We provide novel insights into the complex regulation of PIN abundance and activity during root gravitropism. We show that PIN2 turnover is differentially regulated on the upper and lower side of gravistimulated roots by distinct but partially overlapping auxin feedback mechanisms. In addition to regulating transcription and clathrin-mediated internalization, auxin also controls PIN abundance at the plasma membrane by promoting their vacuolar targeting and degradation. This effect of elevated auxin levels requires the activity of SKP-Cullin-F-box(TIR1/AFB) (SCF(TIR1/AFB))-dependent pathway. Importantly, also suboptimal auxin levels mediate PIN degradation utilizing the same signalling pathway. These feedback mechanisms are functionally important during gravitropic response and ensure fine-tuning of auxin fluxes for maintaining as well as terminating asymmetric growth.


Conflict of interest statement

The authors declare that they have no conflict of interest.

Figures

Figure 1
Figure 1
Localization of PIN2-GFP protein and auxin maxima during root gravitropic response. (AE) Kinetics of the root bending in seedlings at 0 h (A), 2 h (B), 4 h (C), 8 h (D) and 12 h (E) after gravistimulation. (F) Angle of the root curvature in relation to horizon after gravistimulation. n=3 independent experiments with at least six roots analysed for each assay. (GL) Activity of DR5rev::3XVENUS-N7 promoter in seedlings at 0 h (G), 2 h (H), 4 h (I), 8 h (J), 12 h (K) and 24 h (L) after gravistimulation. Pictures represent maximum intensity projection of median root sections (10 Z-sections spaced ∼4.5 μm). (M) Quantification of the DR5rev::3XVENUS-N7 expressing nuclei in the epidermal cells of the gravistimulated root. n=3 independent experiments with at least six roots analysed for each assay. Note a minimum of DR5rev::3XVENUS-N7 expression on the upper side as well as maximum on the lower side of the root 8 h after gravistimulation marked on (J) and graph (M) by red and green discontinuous lines, respectively. (NS) PIN2-GFP protein localization in epidermal and cortical cells at 0 h (N), 2 h (O), 4 h (P), 8 h (Q) and 12 h (R) after gravistimulation. Pictures represent maximum intensity projection of median root sections (10 Z-sections spaced ∼1 μm apart). (S) PIN2-GFP signal intensity in gravistimulated roots. n=3 independent experiments with at least six roots analysed for each assay. Note a decrease in the GFP signal intensity at the upper side of the root between 0 and 4 h after gravistimulation (discontinuous red line on N, P and graph S) as well as, at the lower side of the root, between 2 and 8 h after gravistimulation (discontinuous green line on O, Q and graph S). Error bars represent standard error of the mean (s.e.m.), P-value calculated according to Student’s t-test. Signal intensities are coded white to black and blue to yellow corresponding to increasing intensity levels (see colour scale). cor, cortex; epi, epidermis; lower, lower side of gravistimulated root; upper, upper side of gravistimulated root. Scale bar=10 μm.
Figure 2
Figure 2
Auxin effect on PIN protein degradation. (A, B) Intracellular localization of PIN2-GFP (eir1-1) protein in seedlings incubated with DMSO (A) or with 10 μM NAA (B). (C) Relative PIN2-GFP abundance at the plasma membrane versus the intracellular signal in PIN2::PIN2:GFP (eir1-1) expressing line. n=3 independent experiments with at least six roots analysed for each assay and 60 cells counted in total. (D) Total membrane protein fractions probed with anti-PIN2 antibody. PIN2 protein level decreased when seedlings were treated 3 h with 20 μM NAA. PIN2-specific band at ∼70 kDa is marked with the cross. (E, F) Intracellular localization of 35S::PIN2-EosFP (eir1-1) protein in seedlings incubated with DMSO (E) or with auxin (10 μM/14 h) (F). The effect of auxin on 35S::PIN2-EosFP targeting to the vacuole was observed after an extended auxin treatment probably due to the stabilized expression under 35S promoter, similarly to what was observed with 35S::PIP2-GFP (see Supplementary Figure 4G–I). (G) Relative PIN2-EosFP abundance at the plasma membrane versus intracellular signal in 35S::PIN2-EosFP (eir1-1) expressing line. n=3 independent experiments with at least six roots analysed for each assay and ten cells counted for each root. (H, I) Intracellular localization of PIN2::PIN1-GFP protein in seedlings incubated with DMSO (H) or with 10 μM NAA (I). (J) Relative PIN1-GFP abundance at the plasma membrane versus intracellular signal in PIN2::PIN1-GFP expressing line. n=3 independent experiments with at least six roots analysed for each assay and ten cells counted for each root. (K, L) Intracellular localization of PIN2-GFP in eir1-1 background (F1 generation after cross with Col-0) (K) compared to RPS5»iaaM background (F1 generation after cross with PIN2::PIN2-GFP (eir1-1)) (L). (M) Relative PIN2-GFP abundance at the plasma membrane versus intracellular signal. n=1 with 60 cells analysed. Error bars represent standard error of the mean (s.e.m.), P-value calculated according to Student’s t-test. Arrowheads highlight differences in PIN protein retention at the plasma membrane and accumulation in the vacuoles. Signal intensities are coded blue to yellow corresponding to increasing intensity levels (see colour scale). Scale bar=10 μm.
Figure 3
Figure 3
Auxin analogues affect the SCFTIR1/AFB-mediated signalling pathway and induce PIN protein turnover. (AE) Activity of auxin-responsive promoter DR5rev::GFP (note the absence of induction in the elongation zone of the root marked in the internal panels by green arrowheads) and PIN protein turnover is not induced by DMSO (A), BA (B), naphthalene (C), ILA (D), or I3CA (E). (FJ) Structural auxin analogues, such as NAA (F), 5-F-IAA (G), 5-Br-IAA (H), 2,4,5-T (I) and 5-Cl-IAA (J) are effective in both inducing auxin-responsive promoter DR5rev::GFP (note the induction in the elongation zone of the root marked in the internal panels by red arrowheads) and promoting degradation of PIN proteins. Immunolocalization pictures represent maximum intensity projection of 20 Z-sections spaced ∼3.5 μm apart through the whole root. For quantitative analysis, see Supplementary Figure 7. Green and red arrowheads highlight the absence and presence of the induction in the elongation zone, respectively. Effect of IAA on PIN degradation and induction of DR5rev::GFP expression is presented in Supplementary Figure 6. Signal intensities are coded blue to yellow corresponding to increasing intensity levels (see colour scale). Scale bar=10 μm.
Figure 4
Figure 4
PIN protein degradation induced by auxin via the SCFTIR1/AFB-mediated signalling pathway. (AF) Immunolocalizations of PIN1 and PIN2 proteins after 14-h treatment with 20 μM NAA. Auxin induced PIN protein degradation in the wild type (compare A to D), whereas tir1afb1,2,3 mutant is resistant to the auxin effect on PIN degradation (compare B to E). Auxin induced PIN protein degradation in the abp1-5 mutant (compare C to F). Immunolocalization pictures represent maximum intensity projection of the sections through the whole root (20 Z-sections spaced ∼3.5 μm). (G) Quantification of PIN1 and PIN2 signals at the plasma membrane. n=3 independent experiments with at least six roots analysed for each assay. Error bars represent standard error of the mean (s.e.m.), P-value calculated according to Student’s t-test. For the analysis of auxin-induced degradation in tir1-1 single and double tir1afb1, tir1afb2, tir1afb3 receptor mutant backgrounds, see Supplementary Figure 8. Signal intensities are coded blue to yellow corresponding to increasing intensity levels (see colour scale). Scale bar=10 μm.
Figure 5
Figure 5
The effect of auxin depletion by decapitation on PIN2 protein turnover. (A, B) Activity of the auxin-responsive promoter DR5rev::3XVENUS-N7 14 h after the decapitation (B) compared to the untreated control (A). Note a decreased number of nuclei positive for DR5rev::3XVENUS-N7 expression in epidermis and lateral root cap tissue, marked by the white line. (C) Quantification of DR5rev::3XVENUS-N7 expression in epidermal tissue of seedlings 14 h after decapitation. n=3 independent experiments with at least ten roots analysed for each assay. (D, E) Auxin depletion after decapitation in PIN2::PIN2-GFP (eir1-1) expressing seedlings resulted in increased vacuolar accumulation of PIN2 protein (E) than that of the untreated control (D). (F) Relative PIN2-GFP abundance at the plasma membrane versus intracellular signal in decapitated PIN2::PIN2-GFP (eir1-1) expressing seedlings. n=3 independent experiments with at least six roots analysed for each assay and eight cells counted for each root. (G) Total membrane protein fractions were probed with anti-PIN2 antibody. PIN2 protein levels were decreased 14 h after decapitation. PIN2-specific band at ∼70 kDa is marked with the cross. Error bars represent standard error of the mean (s.e.m.), P-value calculated according to Student’s t-test. Arrowheads highlight differences in vacuolar accumulation of the PIN proteins. White line highlights differences in DR5rev::3XVENUS-N7 expression in epidermis and lateral root cap tissues. Red fluorescence represents propidium iodide staining. decap, decapitated; untr, untreated. Signal intensities are coded blue to yellow corresponding to increasing intensity levels (see colour scale). Scale bar=10 μm.
Figure 6
Figure 6
The effect of chemically induced auxin depletion on PIN2 protein turnover. (A, B) Activity of the DR5rev::3XVENUS-N7 promoter after 3-h treatment with 50 μM PEO-IAA (B) compared to the DMSO-treated control (A). Note a decreased number of nuclei positive for DR5rev::3XVENUS-N7 expression in epidermis and lateral root cap tissue, marked by the white line. (C) Quantification of DR5rev::3XVENUS-N7 expression level in epidermal tissue of seedlings after 3-h treatment with 50 μM PEO-IAA. n=3 independent experiments with at least six roots analysed for each assay. (D, E) Chemical auxin depletion by treatment with 50 μM of PEO-IAA for 3 h resulted in higher vacuolar accumulation of PIN2 protein (E) when compared to DMSO-treated control (D). (F) Relative PIN2-GFP abundance at the plasma membrane versus intracellular signal in PIN2::PIN2-GFP (eir1-1) expressing seedlings treated with 50 μM PEO-IAA. n=3 independent experiments with at least six roots analysed for each assay and ten cells counted for each root. (G) Total membrane protein fractions were probed with anti-PIN2 antibody. PIN2 protein levels were decreased after 3-h treatment with 50 μM PEO-IAA. PIN2-specific band at ∼70 kDa is marked with the cross. (H, I) Increased vacuolar accumulation and decreased plasma membrane abundance of PIN2-GFP after treatment with 1 μM L-Kynurenine (24 h/dark) (I) compared to DMSO-treated control (H). (J) Destablization from the plasma membrane and vacuolar targeting of PIN2-GFP upon L-Kynurenine (see H and I) is reversed when co-treated with 0.1 μM NAA. (K) Relative PIN2-GFP abundance at the plasma membrane versus intracellular signal in PIN2::PIN2-GFP (eir1-1) expressing seedlings treated with L-Kynurenine. n=3 independent experiments with at least six roots analysed for each assay and ten cells counted for each root. Error bars represent standard error of the mean (s.e.m.), P-value calculated according to Student’s t-test. Arrowheads highlight differences in vacuolar accumulation and plasma membrane abundance of PIN2 protein. White line highlights differences in DR5rev::3XVENUS-N7 expression in epidermis and lateral root cap tissues. Red fluorescence represents propidium iodide staining. decap, decapitated; untr, untreated; KYN, L-Kynurenine. Signal intensities are coded blue to yellow corresponding to increasing intensity levels (see colour scale). Scale bar=10 μm.
Figure 7
Figure 7
The effect of genetically reduced transcriptional auxin signalling on PIN2 protein turnover. (A) The effect of heat-shock induction on PIN2 expression in the root apical meristem. n=4 biological replicas with 3 technical repetitions for each. (B) Total membrane protein fractions isolated from HS::axr3-1 genetic background were probed with anti-PIN2 antibody. PIN2 protein levels were decreased 5 h after heat-shock induction. PIN2-specific band at ∼70 kDa is marked with the cross. (C, D) Higher vacuolar PIN2-GFP accumulation in TIR1-mediated auxin signalling-deficient background of the stabilized IAA17 mutation (induced for 2 h at 37°C) (D) than in the same line without an induction (C). Internal panels illustrate the phenotype of HS::axr3-1 seedlings without and after induction. (E) Relative labelling of PIN2-GFP signal at the plasma membrane versus intracellular in HS::axr3-1 background. n=3 independent experiments with at least 5 roots analysed for each assay and 200 cells counted in total. Error bars represent standard error of the mean (s.e.m.), P-value calculated according to Student’s t-test. Arrowheads highlight differences in the plasma membrane stability and vacuolar accumulation of PIN proteins. ind, induced; untr, untreated. Signal intensities are coded blue to yellow corresponding to increasing intensity levels (see colour scale). Scale bar=10 μm.

References

    1. Abas L, Benjamins R, Malenica N, Paciorek T, Wiśniewska J, Moulinier-Anzola JC, Sieberer T, Friml J, Luschnig C (2006) Intracellular trafficking and proteolysis of the Arabidopsis auxin-efflux facilitator PIN2 are involved in root gravitropism. Nat Cell Biol 8: 249–256 - PubMed
    1. Abas L, Luschnig C (2010) Maximum yields of microsomal-type membranes from small amounts of plant material without requiring ultracentrifugation. Anal Biochem 401: 217–227 - PMC - PubMed
    1. Badescu GO, Napier RM (2006) Receptors for auxin: will it all end in TIRs? Trends Plant Sci 11: 217–223 - PubMed
    1. Band LR, Wells DM, Larrieu A, Sun J, Middleton AM, French AP, Brunoud G, Sato EM, Wilson MH, Péret B, Oliva M, Swarup R, Sairanen I, Parry G, Ljung K, Beeckman T, Garibaldi JM, Estelle M, Owen MR, Vissenberg K et al. (2012) Root gravitropism is regulated by a transient latera auxin gradient controlled by a tipping-point mechanism. Proc Natl Acad Sci USA 109: 4668–4673 - PMC - PubMed
    1. Barbez E, Kubeš M, Rolčík J, Béziat C, Pěnčík A, Wang B, Rosquete MR, Zhu J, Dobrev PI, Lee Y, Zažímalovà E, Petrášek J, Geisler M, Friml J, Kleine-Vehn J (2012) A novel putative auxin carrier family regulates intracellular auxin homeostasis in plants. Nature 485: 119–122 - PubMed

Publication types

MeSH terms

LinkOut - more resources