Comparative Study
. 2013 Feb;111(2):271-82.
doi: 10.1093/aob/mcs249. Epub 2012 Dec 4.

Non-destructive estimation of root pressure using sap flow, stem diameter measurements and mechanistic modelling

Affiliations
Comparative Study

Non-destructive estimation of root pressure using sap flow, stem diameter measurements and mechanistic modelling

Tom De Swaef et al. Ann Bot. 2013 Feb.

Abstract

Background: Upward water movement in plants via the xylem is generally attributed to the cohesion-tension theory, as a response to transpiration. Under certain environmental conditions, root pressure can also contribute to upward xylem water flow. Although the occurrence of root pressure is widely recognized, ambiguity exists about the exact mechanism behind root pressure, the main influencing factors and the consequences of root pressure. In horticultural crops, such as tomato (Solanum lycopersicum), root pressure is thought to cause cells to burst, and to have an important impact on the marketable yield. Despite the challenges of root pressure research, progress in this area is limited, probably because of difficulties with direct measurement of root pressure, prompting the need for indirect and non-destructive measurement techniques.

Methods: A new approach to allow non-destructive and non-invasive estimation of root pressure is presented, using continuous measurements of sap flow and stem diameter variation in tomato combined with a mechanistic flow and storage model, based on cohesion-tension principles.

Key results: Transpiration-driven sap flow rates are typically inversely related to stem diameter changes; however, this inverse relationship was no longer valid under conditions of low transpiration. This decoupling between sap flow rates and stem diameter variations was mathematically related to root pressure.

Conclusions: Root pressure can be estimated in a non-destructive, repeatable manner, using only external plant sensors and a mechanistic model.


Figures

Fig. 1.
Fig. 1.
Scheme of the original model, used for simulation and calibration in step 2 of the method (A), and the rearranged model, used for simulation in step 3 of the method (B). Rearranged equations are circled. Ψx = total water potential in xylem compartment; Ψm = total water potential in growing medium; FH2O = water flow in xylem compartment; Rx = hydraulic resistance between growing medium and xylem compartment; Ψπ,s = osmotic potential of storage compartment; ℜ = universal gas constant; T = air temperature; Ms = content of osmotically active compounds in storage compartment; Ws = water content in storage compartment; MMsucrose = molar mass of sucrose; Ψs = total water potential in storage compartment; Ψp,s = hydrostatic water potential in storage compartment; r = hydraulic resistance between storage and xylem compartment; S = rate of change of sugar content in the storage tissues; D = stem diameter; ɛ = bulk elastic modulus in relation to reversible dimensional changes; ɛ0 = proportionality parameter; ϕ = cell wall extensibility; Γ = threshold hydrostatic water potential at which wall yielding occurs.
Fig. 2.
Fig. 2.
(A) Photosynthetically active radiation (PAR), (B) air temperature (T) and (C) vapour pressure deficit of the air (VPD) for a period of 6 d starting on 17 September 2010 at midnight. The shaded bands indicate night-time.
Fig. 3.
Fig. 3.
Measurements of sap flow (formula image 
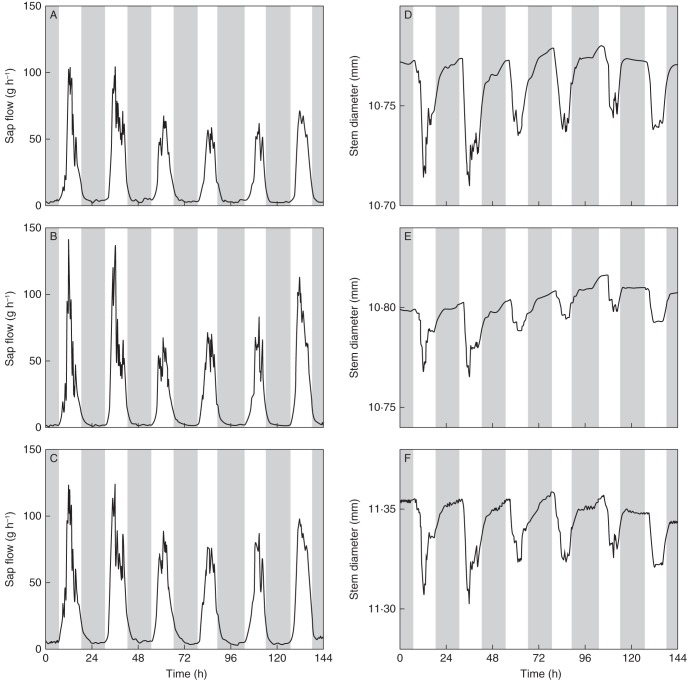
) of plants 1, 2 and 3 (A, B, C, respectively) and stem diameter (D) of plants 1, 2 and 3 (D, E, F, respectively) for a period of 6 d starting on 17 September 2010 at midnight. The shaded bands indicate night-time.
Fig. 4.
Fig. 4.
Simulation results of the original model, outlined in Fig. 1A, of xylem water potential (Ψx) for plants 1, 2 and 3 (A, B, C, respectively) and comparison between simulation results and measurements of stem diameter (D) for the respective plants (D, E, F). All data presented describe a period of 6 d starting on 17 September 2010 at midnight. The shaded bands indicate night-time.
Fig. 5.
Fig. 5.
Comparison between xylem water potential (Ψx) simulated in step 2, based on the original model equations, and step 3, based on the rearranged model equations, for plants 1, 2 and 3 (A, C, E, respectively), together with pressure component (Pr) in the xylem, which is the mathematical difference between Ψx simulated in step 2 and 3 (B, D, F). All data presented describe a period of 6 d starting on 17 September 2010 at midnight. Shaded bands indicate night-time.
Fig. 6.
Fig. 6.
Photosynthetically active radiation (PAR) and vapour pressure deficit (VPD) for three measurement periods in experiment 2, (A) 31 January–3 February 2012, (B) 14– 16 February 2012, and (C) 21–25 February 2012, and corresponding sap flow rates for a young tomato plant (D–F). Comparison between stem diameter measurements and simulations using the original model outlined in Fig. 1A for the respective periods (G–I). Shaded bands indicate night-time.
Fig. 7.
Fig. 7.
Comparison between destructively measured root pressure using a manometer and estimations using the model approach for three measurement periods in experiment 2, (A) 31 January–3 February 2012, (B) 14–16 February 2012, and (C) 21–25 February 2012. Destructively measured data are the mean of two plants. Shaded bands indicate night-time.
Fig. 8.
Fig. 8.
Diurnal profile of simulated xylem water potential and measurement of sap flow of plant 2 on 21 September 2010. The vertical dashed line indicates where sap flow rose sharply. Shaded bands indicate night-time.

References

    1. Angeles G, Bond B, Boyer JS, et al. The cohesion–tension theory. New Phytologist. 2004;163:451–452. - PubMed
    1. van Bavel MG, van Bavel CHM. Dynagage installation and operational manual. Houston, TX: Dynamax Inc; 1990.
    1. Begg JE, Turner NC. Water potential gradients in field tobacco. Plant Physiology. 1970;46:343–346. - PMC - PubMed
    1. Burquez A. Leaf thickness and water deficit in plants – a tool for field studies. Journal of Experimental Botany. 1987;38:109–114.
    1. Canny MJ. A new theory for the ascent of sap: cohesion supported by tissue pressure. Annals of Botany. 1995;75:343–357.

Publication types