Clinical Trial
. 2013 Mar;33(3):372-80.
doi: 10.1038/jcbfm.2012.184. Epub 2012 Dec 5.

Cerebral diffusion and T(2): MRI predictors of acute mountain sickness during sustained high-altitude hypoxia

Affiliations
Clinical Trial

Cerebral diffusion and T(2): MRI predictors of acute mountain sickness during sustained high-altitude hypoxia

John S Hunt Jr et al. J Cereb Blood Flow Metab. 2013 Mar.

Abstract

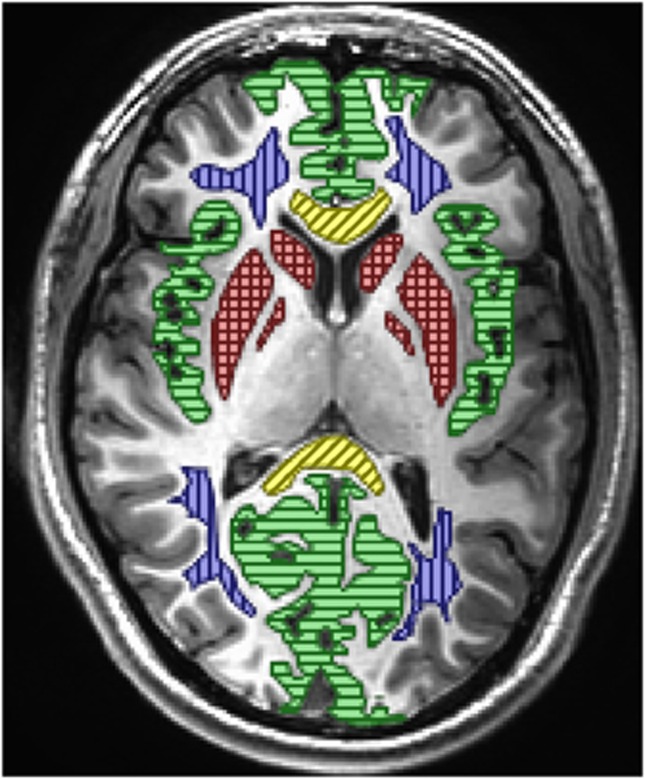
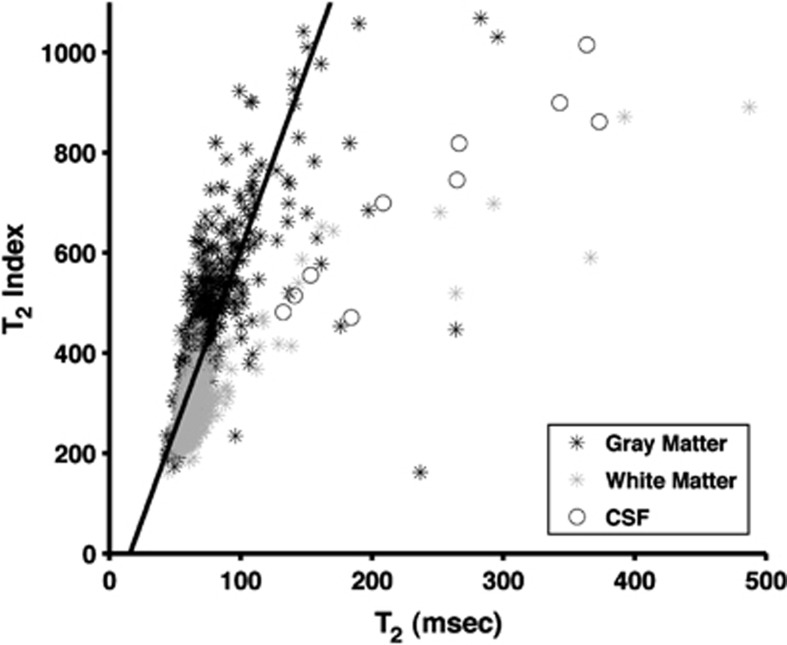
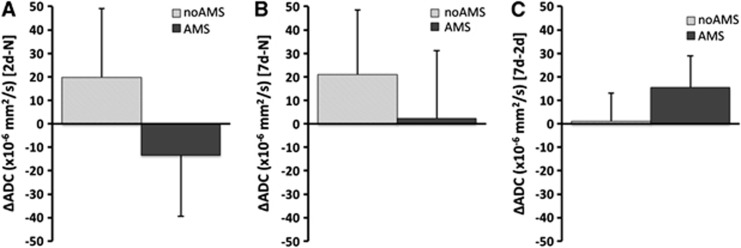
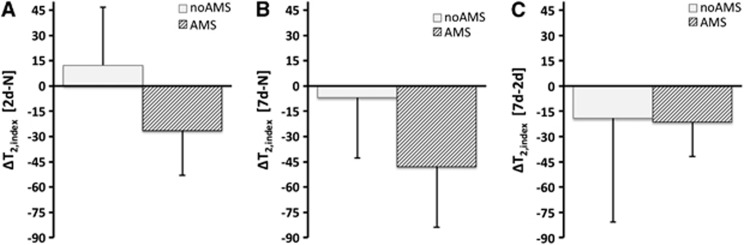
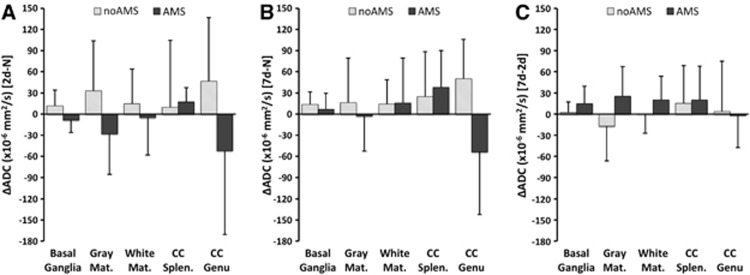
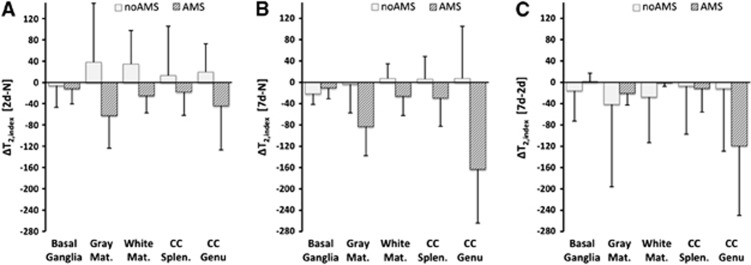
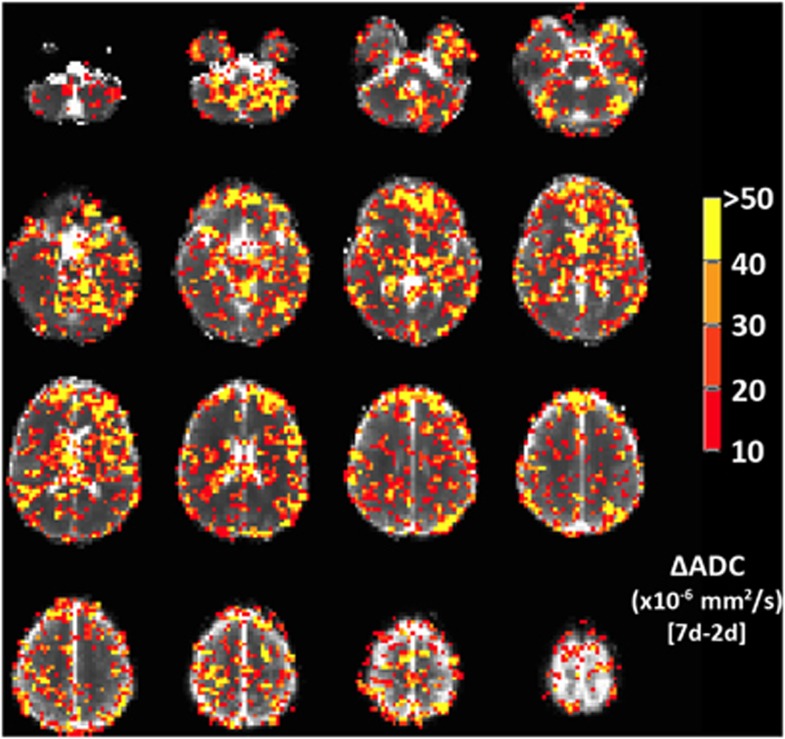
Diffusion magnetic resonance imaging (MRI) provides a sensitive indicator of cerebral hypoxia. We investigated if apparent diffusion coefficient (ADC) and transverse relaxation (T(2)) predict symptoms of acute mountain sickness (AMS), or merely indicate the AMS phenotype irrespective of symptoms. Fourteen normal subjects were studied in two groups; unambiguous AMS and no-AMS at 3,800 m altitude (intermediate AMS scores were excluded). T(2) relaxation was estimated from a T(2) index of T(2)-weighted signal normalized by cerebrospinal fluid signal. Measurements were made in normoxia and repeated after 2 days sustained hypoxia (AMS group symptomatic and no-AMS group asymptomatic) and after 7 days hypoxia (both groups asymptomatic). Decreased ADC directly predicted AMS symptoms (P<0.05). Apparent diffusion coefficient increased in asymptomatic subjects, or as symptoms abated with acclimatization. This pattern was similar in basal ganglia, white matter, and gray matter. Corpus callosum behaved differently; restricted diffusion was absent (or rapidly reversed) in the splenium, and was sustained in the genu. In symptomatic subjects, T(2,index) decreased after 2 days hypoxia and further decreased after 7 days. In asymptomatic subjects, T(2,index) initially increased after 2 days, but decreased after 7 days. T(2,index) changes were not predictive of AMS symptoms. These findings indicate that restricted diffusion, an indicator of diminished cerebral energy status, directly predicts symptoms of AMS in humans at altitude.


Figures

Figure 1
Figure 1
Location of regions of interest used for analysis. Green/horizontal lines=gray matter, blue/vertical lines=white matter, red/cross hatch lines=basal ganglia, and yellow/diagonal lines=corpus callosum (genu anterior and splenium posterior). Mean and standard deviation voxel counts for 18 subjects in the 5 primary regions of interest (Tables 2 and 3, Figures 5 and 6) were gray matter 12,822±3,354, white matter 6,574±70, basal ganglia 3,298±733, splenium of corpus callosum 1,424±602, and genu of corpus callosum 1,450±558. Voxel counts for all regions combined (Figures 3 and 4) 31,275±2,943. Voxel volume is 3.87 mm3. The color reproduction of this figure is available at the Journal of Cerebral Blood Flow and Metabolism journal online.
Figure 2
Figure 2
Scatter plot of T2,index versus T2 relaxation for one subject. Imaging sequence used spin-echo echo-planar imaging as described in text with b=0 s/mm2. For T2,index echo time (TE)=82.9 ms, for T2 relaxation calculation TE1=37.1 ms, TE2=82.9 ms. Voxels identified in image as gray matter, white matter, and cerebrospinal fluid (CSF) using FAST automated segmentation (FSL, Oxford, UK). Image resolution down sampled to 7 × 7 × 4.4 mm to improve signal-to-noise ratio (SNR). Solid line is best fit to gray-matter and white-matter voxels. Y=7.2X+113.9. R2=0.51 P<10−5.
Figure 3
Figure 3
Changes in apparent diffusion coefficient (ADC) for acute mountain sickness (AMS) and no-AMS groups across all cerebral regions. (A) Change in ADC between 2 days hypoxia and normoxia (2d-N) (at this time point, AMS subjects are symptomatic and no-AMS subjects are asymptomatic), (B) between 7 days hypoxia and normoxia (7d-N) (at this time point, all subjects are asymptomatic), (C) between 2 days and 7 days hypoxia (7d-2d) (shows changes occurring during hypoxia acclimatization period). The no-AMS group is characterized by increased ADC on both days (A, B), and little change in ADC during hypoxia acclimatization period. AMS group are characterized by reduced ADC at 2 days when symptomatic, and increased ADC at 7 days when asymptomatic. Large increase in ADC during hypoxia acclimatization period as symptoms abate. Data are mean changes. Error bar=1s.d. Significant differences in ADC between 2 days hypoxia and normoxia (P<0.05, main effect of AMS). At 7 days hypoxia, no significant differences in relative ADC (P=NS, main effect of AMS). During acclimatization period (2 days to 7 days hypoxia) changes in ADC were significant between groups (P<0.05, main effect of AMS).
Figure 4
Figure 4
Changes in T2,index for acute mountain sickness (AMS) and no-AMS groups across all cerebral regions (A, B, and C are same time periods as Figure 1). The no-AMS group have increased T2,index at 2 days and reduced T2,index by day-7 (A, B). The AMS group have reduced T2,index at day-2 and further reduction in T2,index at day-7 (A, B). Both groups show similar reduction in T2,index during acclimatization to hypoxia from day-2 to day-7 despite differences in symptoms (C). Data are mean changes. Error bar=1s.d. Significant differences in ADC at both 2 days and 7 days hypoxia relative to normoxia (P<0.05, main effect of AMS).
Figure 5
Figure 5
Changes in apparent diffusion coefficient (ADC) for acute mountain sickness (AMS) and no-AMS groups across different cerebral regions (basal ganglia, gray matter, white matter, splenium of corpus callosum, genu of corpus callosum—see text for details. Panels (A), (B), and (C) are same time periods as Figure 1). The no-AMS group shows a broadly similar pattern in all regions with increased ADC at 2 days hypoxia relative to normoxia (A), which is still elevated at 7 days hypoxia (B). The AMS group show decreased ADC when symptomatic at 2 days hypoxia in basal ganglia, gray matter, and white matter (A), with normalization or increased ADC at 7 days when asymptomatic (B). Different pattern of ADC change is seen in the AMS group in corpus callosum: in the splenium (CC splen.) ADC is initially increased despite symptoms of AMS (A), which increases further at 7 days (B). In the genu (CC Genu), the ADC is initially reduced at 2 days hypoxia relative to normoxia, and shows no change by 7 days despite recovery of symptoms (B, C). Data are mean changes. Error bar=1s.d. Significant differences in ADC at both 2 days and 7 days hypoxia relative to normoxia (P<0.05, main effect of AMS), and between regions at 7 days (P<0.01, AMS × region interaction).
Figure 6
Figure 6
Changes in T2,index for acute mountain sickness (AMS) and no-AMS groups for different cerebral regions (regions are same as Figure 3. Panels (A), (B), and (C) are same time periods as Figure 1). Broadly similar pattern in all regions except basal ganglia. The no-AMS group have increased T2,index at 2 days, which has returned to approximately normoxia apparent diffusion coefficient (ADC) levels by 7 days (A, B). The AMS group has reduced T2,index at 2 days and further reduction in T2,index at 7 days (A, B). Genu of the corpus callosum (CC Genu) shows especially large reductions in T2,index during 2-day to 7-day acclimatization period (C). In basal ganglia, the no-AMS group shows an initial decrease in T2,index at 2 days relative to normoxia (A). The AMS group shows an initial decrease in T2,index with no further reduction by 7 days. Error bar=1s.d. Significant differences in T2,index at both 2 days and 7 days hypoxia relative to normoxia (P<0.05, main effect of AMS), and between regions at 7 days (P<0.0005, main effect of region, and P<0.0001 AMS × region interaction).
Figure 7
Figure 7
Voxel-wise changes in apparent diffusion coefficient (ADC), showing voxels with a signal change corresponding to symptoms of acute mountain sickness (AMS). Color scale indicates ADC change between symptomatic (AMS group) and asymptomatic (no-AMS group) evaluated as the difference between ADC at 2 days hypoxia (when AMS subjects are symptomatic, no-AMS subject are asymptomatic) and 7 days hypoxia (when all subject are asymptomatic). Voxels with ADC change <10 × 10−6 s/mm2 (i.e., insignificant difference between AMS and no-AMS group) or ADC change >100 × 10−6 s/mm2 (i.e., artifactually large changes, likely because of misregistration subtraction errors) are not colored. Map indicates that basal ganglia, frontal gray matter, and regions of parietal and temporal cortex, as well as scattered areas of white matter in centrum semiovale show ADC changes that increase with AMS symptoms. The color reproduction of this figure is available at the Journal of Cerebral Blood Flow and Metabolism journal online.

References

    1. Basnyat B, Murdoch DR. High-altitude illness. Lancet. 2003;361:1967–1974. - PubMed
    1. Hackett PH, Roach RC. High-altitude illness. N Engl J Med. 2001;345:107–114. - PubMed
    1. Hackett PH, Yarnell PR, Hill R, Reynard K, Heit J, McCormick J. High-altitude cerebral edema evaluated with magnetic resonance imaging: clinical correlation and pathophysiology. JAMA. 1998;280:1920–1925. - PubMed
    1. Matsuzawa Y, Kobvayashi T, Fujimoto K, Schinozaki S.Cerebral edema in acute mountain sicknessIn: Reeves JT, Sekiguchi M, (eds). High-Altitude Medicine Shinshu University Matsumoto, Japan; 1992300–304.
    1. Fischer R, Vollmar C, Thiere M, Born C, Leitl M, Pfluger T, et al. No evidence of cerebral oedema in severe acute mountain sickness. Cephalalgia. 2004;24:66–71. - PubMed

Publication types

LinkOut - more resources