Subcellular redistribution and mitotic inheritance of transition metals in proliferating mouse fibroblast cells
- PMID: 23212029
- PMCID: PMC3769613
- DOI: 10.1039/c2mt20176c
Subcellular redistribution and mitotic inheritance of transition metals in proliferating mouse fibroblast cells
Abstract
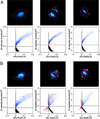
Synchrotron X-ray fluorescence microscopy of non-synchronized NIH 3T3 fibroblasts revealed an intriguing redistribution dynamics that defines the inheritance of trace metals during mitosis. At metaphase, the highest density areas of Zn and Cu are localized in two distinct regions adjacent to the metaphase plate. As the sister chromatids are pulled towards the spindle poles during anaphase, Zn and Cu gradually move to the center and partition into the daughter cells to yield a pair of twin pools during cytokinesis. Colocalization analyses demonstrated high spatial correlations between Zn, Cu, and S throughout all mitotic stages, while Fe showed consistently different topographies characterized by high-density spots distributed across the entire cell. Whereas the total amount of Cu remained similar compared to interphase cells, mitotic Zn levels increased almost 3-fold, suggesting a prominent physiological role that lies beyond the requirement of Zn as a cofactor in metalloproteins or messenger in signaling pathways.
Figures


Similar articles
-
Different element ratios of red cosmetics excavated from ancient burials of Japan.Sci Total Environ. 1997 Jul 1;199(3):293-8. doi: 10.1016/s0048-9697(97)05474-0. Sci Total Environ. 1997. PMID: 9200870
-
The association between content of the elements S, Cl, K, Fe, Cu, Zn and Br in normal and cirrhotic liver tissue from Danes and Greenlandic Inuit examined by dual hierarchical clustering analysis.J Trace Elem Med Biol. 2014 Jan;28(1):50-5. doi: 10.1016/j.jtemb.2013.08.003. Epub 2013 Sep 1. J Trace Elem Med Biol. 2014. PMID: 24140180
-
Trace mineral supplies for populations of little and large herbivores.PLoS One. 2021 Mar 15;16(3):e0248204. doi: 10.1371/journal.pone.0248204. eCollection 2021. PLoS One. 2021. PMID: 33720946 Free PMC article.
-
Medical applications of Cu, Zn, and S isotope effects.Metallomics. 2016 Oct 1;8(10):1056-1070. doi: 10.1039/c5mt00316d. Metallomics. 2016. PMID: 27513195 Review.
-
Towards a unifying model for the metaphase/anaphase transition.Mutagenesis. 1998 Jul;13(4):321-35. doi: 10.1093/mutage/13.4.321. Mutagenesis. 1998. PMID: 9717168 Review.
Cited by
-
The Role of 8-Amidoquinoline Derivatives as Fluorescent Probes for Zinc Ion Determination.Sensors (Basel). 2021 Jan 5;21(1):311. doi: 10.3390/s21010311. Sensors (Basel). 2021. PMID: 33466407 Free PMC article. Review.
-
Physicochemical properties of cells and their effects on intrinsically disordered proteins (IDPs).Chem Rev. 2014 Jul 9;114(13):6661-714. doi: 10.1021/cr400695p. Epub 2014 Jun 5. Chem Rev. 2014. PMID: 24901537 Free PMC article. Review. No abstract available.
-
Synchrotron X-Ray Fluorescence Nanoprobe Reveals Target Sites for Organo-Osmium Complex in Human Ovarian Cancer Cells.Chemistry. 2017 Feb 21;23(11):2512-2516. doi: 10.1002/chem.201605911. Epub 2017 Jan 26. Chemistry. 2017. PMID: 28012260 Free PMC article.
-
High-affinity Cu(I) chelator PSP-2 as potential anti-angiogenic agent.Sci Rep. 2019 Oct 1;9(1):14055. doi: 10.1038/s41598-019-50494-5. Sci Rep. 2019. PMID: 31575910 Free PMC article.
-
Across the spectrum: integrating multidimensional metal analytics for in situ metallomic imaging.Metallomics. 2019 Jan 23;11(1):29-49. doi: 10.1039/c8mt00235e. Metallomics. 2019. PMID: 30499574 Free PMC article. Review.
References
-
- Gambling L, McArdle HJ. Proc. Nutr. Soc. 2004;63:553. - PubMed
-
- Philips N, Hwang H, Chauhan S, Leonardi D, Gonzalez S. Connect. Tissue Res. 2010;51:224. - PubMed
- Lansdown ABG, Mirastschijski U, Stubbs N, Scanlon E, Agren MS. Wound Repair Regen. 2007;15:2. - PubMed
- Binnebösel M, Grommes J, Koenen B, Junge K, Klink CD, Stumpf M, Ottinger AP, Schumpelick V, Klinge U, Krones CJ. Int. J. Colorectal Dis. 2010;25:251. - PubMed
- Borkow G, Gabbay J, Zatcoff RC. Med. Hypoth. 2008;70:610. - PubMed
-
- Raju KS, Alessandri G, Ziche M, Gullino PM. J. Natl. Cancer Inst. 1982;69:1183. - PubMed
- Hu G. J. Cell. Biochem. 1998;69:326. - PubMed
- Finney L, Mandava S, Ursos L, Zhang W, Rodi D, Vogt S, Legnini D, Maser J, Ikpatt F, Olopade OI, Glesne D. Proc. Natl. Acad. Sci. U.S.A. 2007;104:2247. - PMC - PubMed
- Finney L, Vogt S, Fukai T, Glesne D. Clin. Exp. Pharmacol. Physiol. 2009;36:88. - PMC - PubMed
- Gérard C, Bordeleau L-J, Barralet J, Doillon CJ. Biomaterials. 2010;31:824. - PubMed
- D'Andrea LD, Romanelli A, Di Stasi R, Pedone C. Dalton Trans. 2010;39:7625. - PubMed
Publication types
MeSH terms
Substances
Grants and funding
LinkOut - more resources
Full Text Sources
Other Literature Sources
Medical
Research Materials

