. 2012:3:1245.
doi: 10.1038/ncomms2266.

Symptomatic atherosclerosis is associated with an altered gut metagenome

Affiliations
Free PMC article

Symptomatic atherosclerosis is associated with an altered gut metagenome

Fredrik H Karlsson et al. Nat Commun. 2012.
Free PMC article

Abstract

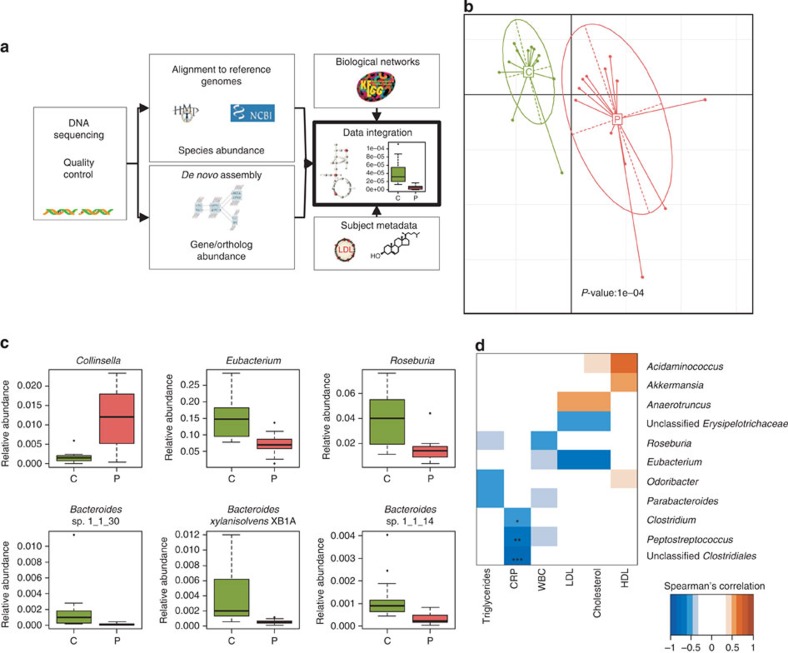
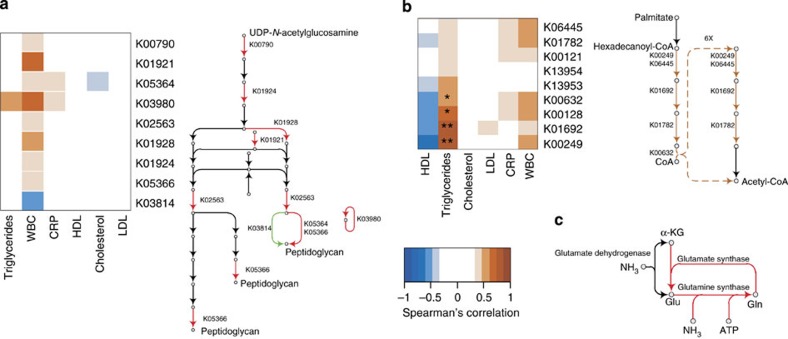
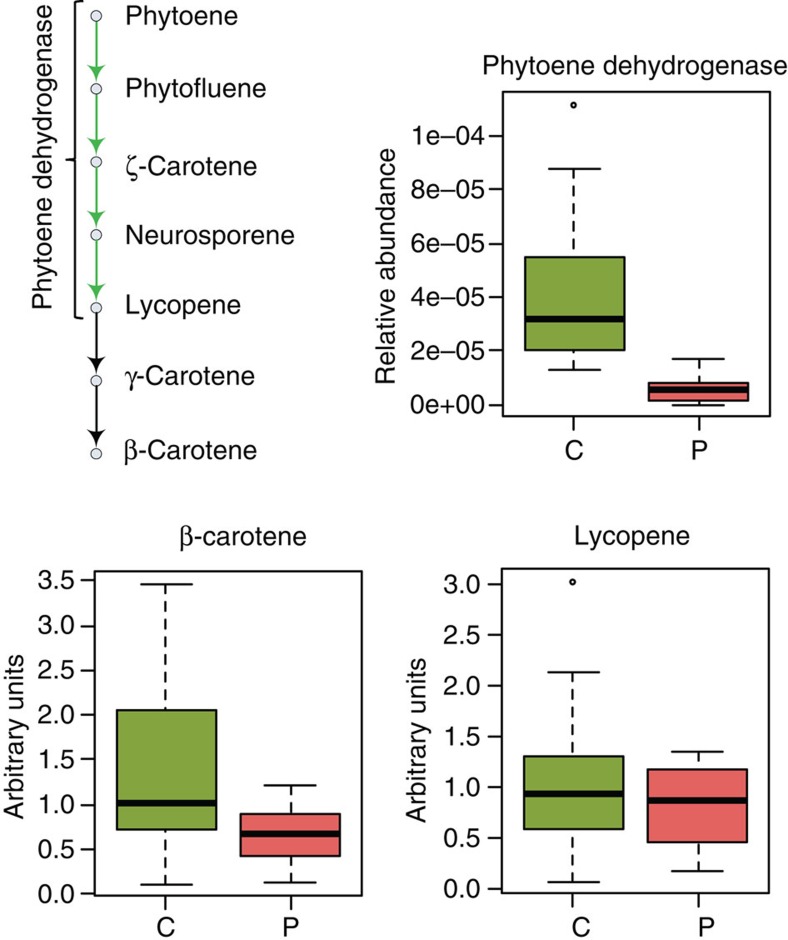
Recent findings have implicated the gut microbiota as a contributor of metabolic diseases through the modulation of host metabolism and inflammation. Atherosclerosis is associated with lipid accumulation and inflammation in the arterial wall, and bacteria have been suggested as a causative agent of this disease. Here we use shotgun sequencing of the gut metagenome to demonstrate that the genus Collinsella was enriched in patients with symptomatic atherosclerosis, defined as stenotic atherosclerotic plaques in the carotid artery leading to cerebrovascular events, whereas Roseburia and Eubacterium were enriched in healthy controls. Further characterization of the functional capacity of the metagenomes revealed that patient gut metagenomes were enriched in genes encoding peptidoglycan synthesis and depleted in phytoene dehydrogenase; patients also had reduced serum levels of β-carotene. Our findings suggest that the gut metagenome is associated with the inflammatory status of the host and patients with symptomatic atherosclerosis harbor characteristic changes in the gut metagenome.


Conflict of interest statement

J.N and F.B. are shareholders in MetaboGen AB. All other authors declare no competing financial interests.

Figures

Figure 1
Figure 1. Microbial composition associated with symptomatic atherosclerosis.
(a) Illustration of our bioinformatics pipeline for analysing metagenome data to elucidate its relation to human metabolic disease. Sequence reads from the gut metagenome were generated with high-throughput sequencing technology and subjected to quality control. High-quality reads were used for alignment to reference genomes to estimate species abundance. De novo assembly of the metagenome allows for discovery of new genes not yet found in databases. Annotation of genes to KEGG allows for integration of information at the gene level with the metabolic network. Data on plasma metabolites and proteins together with gut metagenomic data constitute a basis for discovery of mechanisms for gut metagenome association with etiology of complex diseases. (b) Principal component analysis of microbial species abundance using health status as instrumental variable. Red is patients (P, n=12), green controls (C, n=13). The relation between microbial abundance and health status was assessed with Monte Carlo simulations with 10,000 replications by which a P-value was calculated. (c) Abundance of bacterial genera and species that differ between patients (n=12) with symptomatic atherosclerosis (P) and controls (n=13) (C). Adj. P<0.05 for all. (d) Bacterial genera correlating with biomarkers of atherosclerosis, using Spearman’s correlation. All samples, including the two excluded controls (see methods for details), were used for correlations with triglycerides, CRP (n=27, respectively) and white blood cell count (WBC; n=23). Only controls were used for low-density lipoprotein (LDL), high-density lipoprotein (HDL) and cholesterol correlations to avoid interactions with possible drug effects (n=15). *Adj. P<0.05, **adj. P<0.01 and ***adj. P<0.001. Boxes denote the interquartile range (IQR) between the first and third quartiles and the line within denotes the median; whiskers denote the lowest and highest values within 1.5 times IQR from the first and third quartiles, respectively. Circles denote data points beyond the whiskers.
Figure 2
Figure 2. Symptomatic atherosclerosis correlates with gut enterotypes.
(a) Three enterotypes in our cohort based on the abundance of genera. Controls and patients are denoted by filled triangles and empty triangles, respectively. Two subjects not included in the comparison are represented by empty circles. Green is enterotype 1, red is enterotype 2 and blue is enterotype 3. (b) Abundance of Bacteroides, Prevotella and Ruminococcus, proposed drivers of the three enterotypes. Boxes denote the interquartile range (IQR) between the first and third quartiles and the line within denotes the median; whiskers denote the lowest and highest values within 1.5 times IQR from the first and third quartiles, respectively. Circles denote data points beyond the whiskers.
Figure 3
Figure 3. KOs are associated with symptomatic atherosclerosis.
(a) Peptidoglycan KOs were enriched in patients and eight out of nine KOs correlated positively with white blood cell levels. (b) β-Oxidation KOs correlate with plasma triglyceride levels. (c) The glutamine synthetase—glutamine oxoglutarate aminotransferase system (K00265, K00266 and K01915) with high affinity for ammonium is enriched in patients. In all panels, red indicates enriched in patients (P), green indicates enriched in controls (C). *Adj. P<0.05, **adj. P<0.01 and ***adj. P<0.001. All samples were used for correlations with triglycerides, CRP (n=27, respectively) and white blood cell count (WBC; n=23). Only controls were used for low-density lipoprotein (LDL), high-density lipoprotein (HDL) and cholesterol correlations to avoid interactions with possible drug effects (n=15). Adj., adjusted.
Figure 4
Figure 4. Phytoene dehydrogenase K10027 is enriched in the gut metagenome of healthy controls.
β-Carotene (P=0.05, Student’s t-test) but not lycopene (P=0.35, Student’s t-test) was enriched in serum of healthy controls. Red is patients (P), green controls (C). Boxes denote the interquartile range (IQR) between the first and third quartiles and the line within denotes the median; whiskers denote the lowest and highest values within 1.5 times IQR from the first and third quartiles, respectively. Circles denote data points beyond the whiskers.

References

    1. Bäckhed F., Ley R. E., Sonnenburg J. L., Peterson D. A., Gordon J. I. Host-bacterial mutualism in the human intestine. Science 307, 1915–1920 (2005). - PubMed
    1. Cani P. D. et al. Metabolic endotoxemia initiates obesity and insulin resistance. Diabetes 56, 1761–1772 (2007). - PubMed
    1. Bäckhed F. et al. The gut microbiota as an environmental factor that regulates fat storage. Proc. Natl Acad. Sci. USA 101, 15718–15723 (2004). - PMC - PubMed
    1. Ley R. E., Turnbaugh P. J., Klein S., Gordon J. I. Microbial ecology: human gut microbes associated with obesity. Nature 444, 1022–1023 (2006). - PubMed
    1. Erridge C., Attina T., Spickett C. M., Webb D. J. A high-fat meal induces low-grade endotoxemia: evidence of a novel mechanism of postprandial inflammation. Am. J. Clin. Nutr. 86, 1286–1292 (2007). - PubMed

Publication types