. 2012:3:1246.
doi: 10.1038/ncomms2250.

Synaptic tagging and capture in the living rat

Affiliations

Synaptic tagging and capture in the living rat

K L Shires et al. Nat Commun. 2012.

Abstract

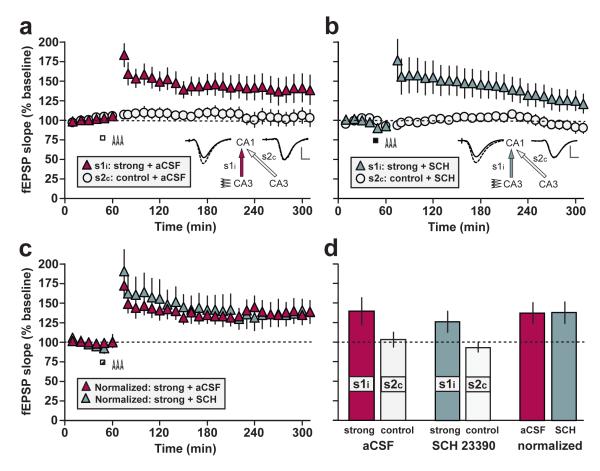
In isolated hippocampal slices, decaying long-term potentiation can be stabilized and converted to late long-term potentiation lasting many hours, by prior or subsequent strong high-frequency tetanization of an independent input to a common population of neurons-a phenomenon known as 'synaptic tagging and capture'. Here we show that the same phenomenon occurs in the intact rat. Late long-term potentiation can be induced in CA1 during the inhibition of protein synthesis if an independent input is strongly tetanized beforehand. Conversely, declining early long-term potentiation induced by weak tetanization can be converted into lasting late long-term potentiation by subsequent strong tetanization of a separate input. These findings indicate that synaptic tagging and capture is not limited to in vitro preparations; the past and future activity of neurons has a critical role in determining the persistence of synaptic changes in the living animal, thus providing a bridge between cellular studies of protein synthesis-dependent synaptic potentiation and behavioural studies of memory persistence.


Figures

Figure 1
Figure 1. Experimental set-up
(a) Photomicrograh of coronal sections indicating the location of bilateral stimulating electrodes in CA3 (s1 and s2) and a recording electrode in left CA1 (R); the right-hand recording electrode was visible only in a slightly more posterior section. Arrows indicate the location of marking lesions made at the electrode tips; scale bar = 0.5 mm. (b) Schematic diagram of stimulating and recording sites (s1 and s2), and ipsilateral and contralateral CA3-CA1 projections (s1i and s2c). In this example, both pathways converge on a common population of neurons whose synaptic responses are sampled by the left-hand recording electrode, R. For simplicity, CA3-CA3 projections are omitted (see Supplementary Methods) (c) Representative fEPSPs evoked by stimulation of s1i and s2c. Note the longer latency and smaller amplitude of the contralateral fEPSP (scale bar: vertical = 2 mV; horizontal = 5 ms). (d) Intra-pathway paired stimulation at an interval of 50 ms yielded pronounced paired-pulse facilitation (PPF) of the fEPSP slope; the left-hand bar shows a single example of PPF in the ipsilateral CA3-CA1 projection; examples of fEPSPs elicited by paired stimulation are shown. However, PPF was absent after stimulation of s2c followed by s1i at an interval of 50 ms; the middle bar shows mean (± SEM) PPF for all experiments reported in Figs. 2 & 4 (n = 51), a value that did not differ from chance (100 %) [100.2 ± 0.8; t(50) = 0.20; p > 0.8; one-sample t-test], confirming the independence of the 2 pathways. Independence was compromised if one or both stimulating electrodes were raised into CA1; the right-hand bar shows an example of modest PPF obtained in a single rat by paired stimulation of contralateral CA3 followed by ipsilateral CA1, indicating that the two stimulators now activate partially overlapping populations of afferents. Examples of fEPSPs elicited by stimulation of s1i with (solid line) or without (dashed line) prior stimulation of s2c are shown above the middle and right-hand bars (scale bar: vertical = 4 mV; horizontal = 10 ms).
Figure 2
Figure 2. Strong-before-strong protocol
(a) Bilateral intraventricular infusion of aCSF (white rectangle) starting 15 min before strong tetanization of s1i (arrowheads) had no effect on late-LTP in s1i (‘strong + aCSF’; n = 6). (b) Infusion of anisomycin (black rectangle) completely blocked late LTP in s1i (‘strong + ANI’; n = 7). (c) The addition of a strong tetanus to s2c ending 15 min before the start of anisomycin infusion and tetanization of s1i resulted in late-LTP in both pathways (‘strong-before-strong + ANI’ group, comprising ‘strong + ANI rescued’ and ‘strong rescuer’ pathways; n = 9). Sample fEPSPs recorded in s1i and s2c before (dotted line) and 5 h after tetanization (solid line) are shown (scale bars for a-c: vertical = 2 mV; horizontal = 5 ms). (d) Mean fEPSP slope values recorded for s1i and s2c in all experimental groups between 4-5 h after the relevant tetanus, and normalized to the mean of the 1-h baseline period. Asterisks indicate significant group differences in late-LTP (*p < 0.05; **p < 0.01; ***p < 0.001; post-hoc comparisons—Fisher’s LSD). All data are plotted as mean ± SEM.
Figure 3
Figure 3. Dose-dependent depression of the fEPSP slope by higher doses of anisomycin
fEPSP slope 0-30 min and 60-120 min after the end of drug infusion (as a percentage of the value recorded during a 30-min baseline period) is plotted for a range of doses of anisomycin (expressed as μg / μl). All doses were delivered in a total volume of 10 μl (5 μl per ventricle) over 10 min. As the effects of anisomycin were proportionally similar in both ipsilateral and contralateral CA3-CA1 pathways, data from all pathways were combined in this analysis [2.5 μg / μl: n = 6 (3 rats); 5.0 μg / μl: n = 13 (8 rats; data from all control pathways in ‘ANI + strong’ group, Fig. 2); 12.5 μg / μl: n = 4 (1 rat); 25 μg / μl: n = 4 (1 rat); 100 μg / μl: n = 8 (2 rats)]. A main effect of dose was observed both 0-30 min [F(4,30) = 6.15; p < 0.002] and 60-120 min post-infusion [F(4,30) = 19.3; p < 0.001]. Asterisks indicate significant deviations from baseline (100 %; ** p < 0.01; * p < 0.05; one-sample t-tests with Bonferroni correction). All data are plotted as mean ± SEM.
Figure 4
Figure 4. Weak-before-strong protocol
(a) Strong tetanization (arrowheads) of ipsilateral CA3 (s1i) induced stable late-LTP (‘strong only’; n = 7). (b) Weak tetanization of s1i (arrowhead) induced decremental early-LTP that reached baseline within approximately 3 h (‘weak only’; n =11). (c) Strong tetanization of s2c 30 min after weak tetanization of s1i resulted in late-LTP in both pathways (‘weak-before-strong’; n = 11). Sample fEPSPs recorded in s1i and s2c before (dotted line) and 5 h after tetanization (solid line) are shown in a-c (scale bar: vertical = 2mV; horizontal = 5ms). (d) Mean normalized fEPSP slope in s1i and s2c recorded 4-5 h after tetanization in all groups. Asterisks indicate significant differences in late-LTP between groups (*p < 0.05; **p < 0.01; ***p < 0.001; post-hoc comparisons—Fisher’s LSD). (e & f) Re-analysis of ‘weak-only’ (e; n = 8) and ‘weak-before-strong’ (f; n = 7) data after the exclusion of data from all animals in which baseline fEPSP slope values fell by more than 10 percentage points between the first and last 20-min periods of the 1-h baseline in either s1i or s2c. The pattern of results is identical to that observed in b and c. All data are plotted as mean ± SEM.
Figure 5
Figure 5. Dopamine and late LTP
(a) Bilateral intraventricular infusion of aCSF (n = 7; white rectangle) starting 15 min before strong tetanization of s1i (arrowheads) had no effect on late-LTP in s1i. (b) Despite a slight baseline fall in both s1i and s2c after infusion, SCH23390 (n = 7; black rectangle) likewise failed to block late-LTP. Sample fEPSPs recorded in s1i and s2c before (dotted line) and 4 h after tetanization (solid line) are shown in a & b (scale bar: vertical = 2mV; horizontal = 5ms). (c) In order to eliminate the possible influence of infusion-related baseline changes, values in s1i were normalized, in each animal, to those in s2c and the mean data were re-plotted (see Methods). SCH23390 had no effect on normalized levels of LTP. The point of drug infusion is indicated by a black-and-white rectangle. All data are plotted as mean ± SEM.
Figure 6
Figure 6. Depth profiles during electrode implantation
(a & b) Changes in peak fEPSP amplitude elicited by ipsilateral (a) and contralateral (b) CA3 stimulation as a recording electrode is lowered into the hippocampus of a single rat; sample fEPSPs are shown at different depths (scale bar: vertical = 3 mV; horizontal = 5 ms); note the large negative-going responses elicited in the stratum radiatum by both ipsilateral and contralateral stimulation. (c) A schematic illustration of the locations of recording and stimulating electrode (see below) tracks in the same rat, based on the coronal section in which the location of the stimulating electrodes was most clearly visible. (d & e) Examples of fEPSP amplitude depth profiles recorded in the same animal as a stimulating electrode was lowered ipsilaterally (d) or contralaterally (e) relative to a stationary recording electrode in the stratum radiatum. Note the large negative-going responses elicited by both ipsilateral and contralateral stimulation of CA1 and CA3; sample fEPSPs are shown (scale bar: vertical = 3 mV; horizontal = 5 ms).
Figure 7
Figure 7. Histology
Locations of the marking lesions made via all stimulating (filled stars) and recording electrodes (filled circles) used in Experiment 1 (a), Experiment 2 (b), and Experiment 3 (c); the locations of infusion cannulae are indicated by open squares in (c). Numbers indicate distance from bregma. Figures are adapted from Paxinos and Watson, 2005.

Similar articles

Cited by

References

    1. Martin SJ, Grimwood PD, Morris RGM. Synaptic plasticity and memory: an evaluation of the hypothesis. Annu. Rev. Neurosci. 2000;23:649–711. - PubMed
    1. Wiesel TN, Hubel DH. Single-cell responses in striate cortex of kittens deprived of vision in one eye. J. Neurophysiol. 1963;26:1003–1017. - PubMed
    1. Bienenstock EL, Cooper LN, Munro PW. Theory for the development of neuron selectivity: orientation specificity and binocular interaction in visual cortex. J. Neurosci. 1982;2:32–48. - PMC - PubMed
    1. Hubener M, Bonhoeffer T. Searching for engrams. Neuron. 2010;67:363–371. - PubMed
    1. Hawkins RD, Kandel ER, Bailey CH. Molecular mechanisms of memory storage in Aplysia. Biol. Bull. 2006;210:174–191. - PubMed

Publication types