. 2012:3:1251.
doi: 10.1038/ncomms2249.

Dynamic blastomere behaviour reflects human embryo ploidy by the four-cell stage

Affiliations
Free PMC article

Dynamic blastomere behaviour reflects human embryo ploidy by the four-cell stage

Shawn L Chavez et al. Nat Commun. 2012.
Free PMC article

Abstract

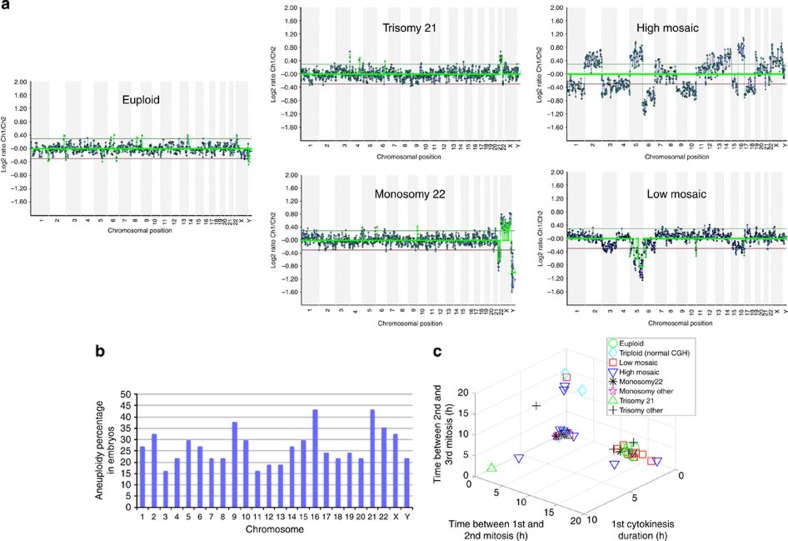
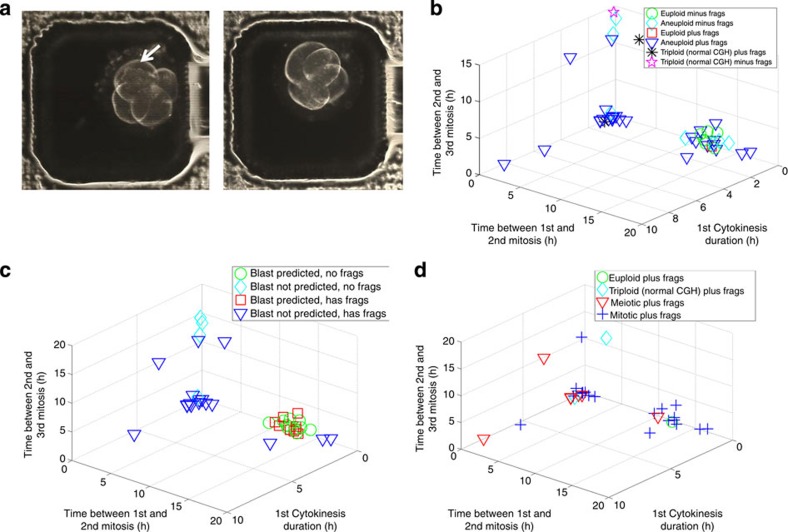
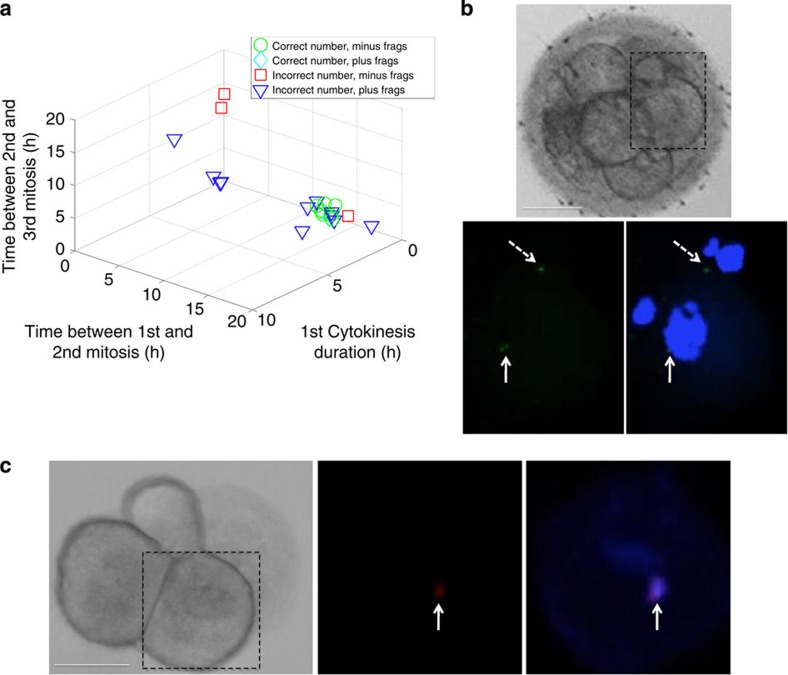
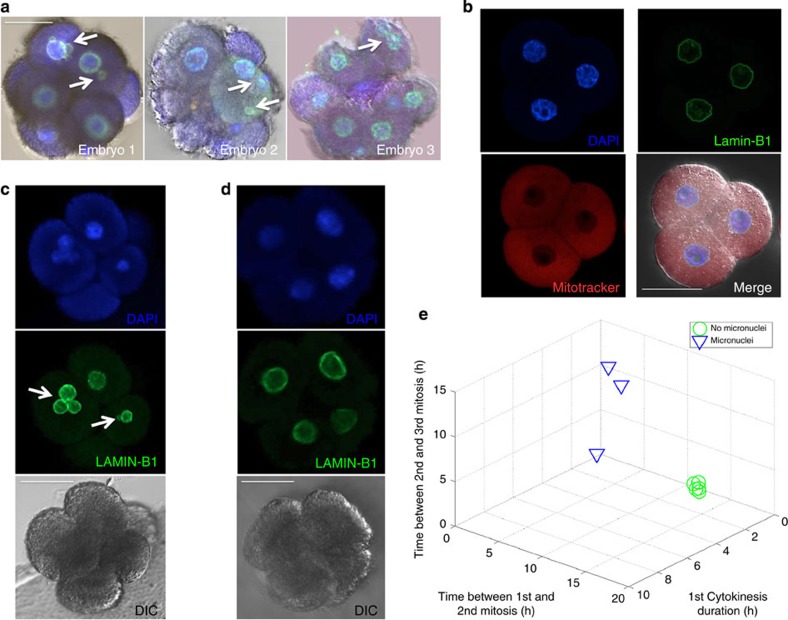
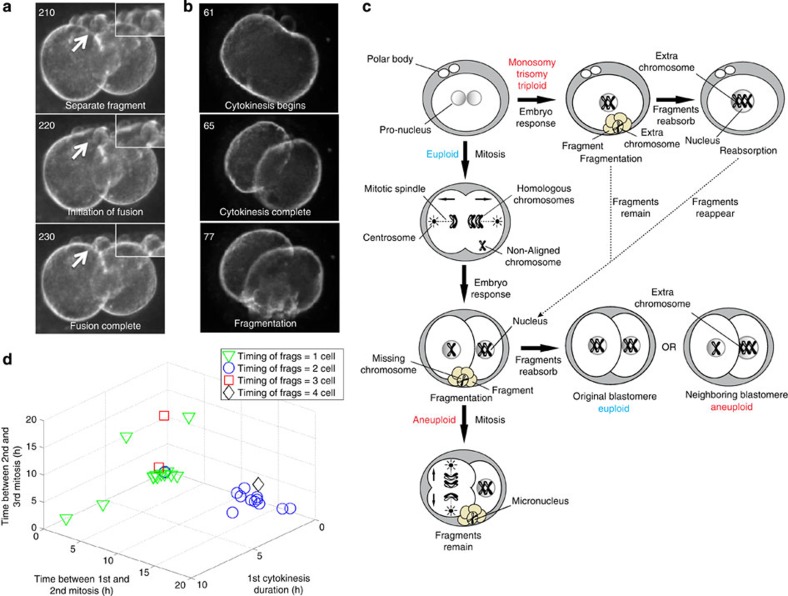
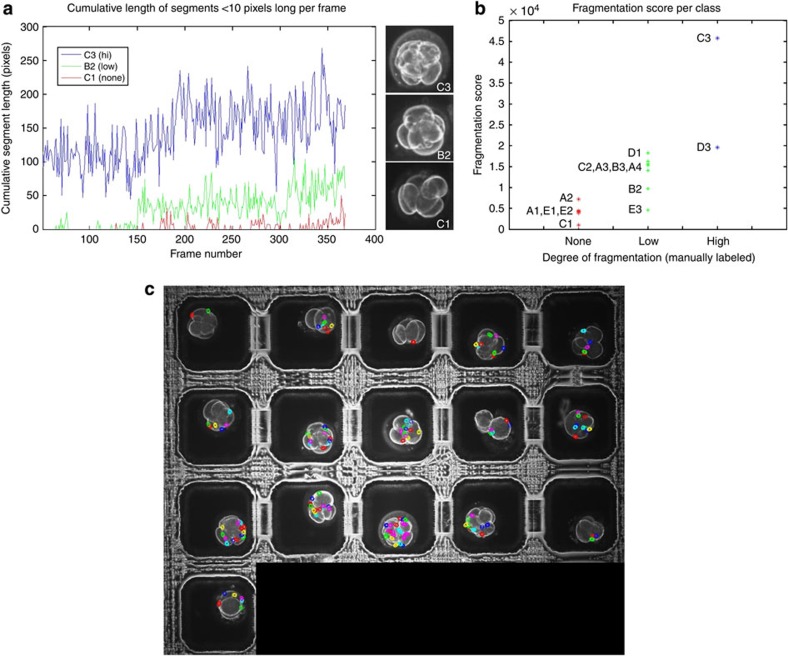
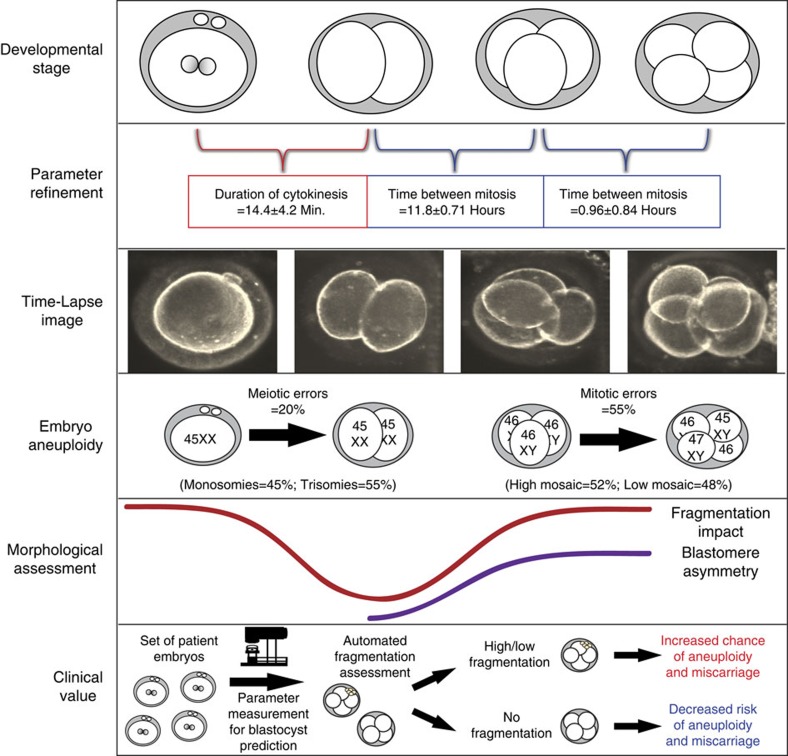
Previous studies have demonstrated that aneuploidy in human embryos is surprisingly frequent with 50-80% of cleavage-stage human embryos carrying an abnormal chromosome number. Here we combine non-invasive time-lapse imaging with karyotypic reconstruction of all blastomeres in four-cell human embryos to address the hypothesis that blastomere behaviour may reflect ploidy during the first two cleavage divisions. We demonstrate that precise cell cycle parameter timing is observed in all euploid embryos to the four-cell stage, whereas only 30% of aneuploid embryos exhibit parameter values within normal timing windows. Further, we observe that the generation of human embryonic aneuploidy is complex with contribution from chromosome-containing fragments/micronuclei that frequently emerge and may persist or become reabsorbed during interphase. These findings suggest that cell cycle and fragmentation parameters of individual blastomeres are diagnostic of ploidy, amenable to automated tracking algorithms, and likely of clinical relevance in reducing transfer of embryos prone to miscarriage.


Conflict of interest statement

This research project was conducted at Stanford University. K.E.L. and F.M. are employees of Auxogyn, Inc. K.E.L., B.B. and R.A.R.P own stock in Auxogyn.

Figures

Figure 1
Figure 1. Distinction between euploid and aneuploid embryos using dynamic parameter analysis.
(a) A-CGH profiles of individual blastomeres showing the copy number of each chromosome in euploid, trisomy 21, monosomy 22, high-mosaic and low-mosaic embryos plotted in the 2D and 3D graphs. Copy number is based on the log2 ratio of the average signal intensity of the test to reference DNA for each chromosome. Low-mosaic embryos exhibited losses or gains in four chromosomes or less, whereas more than four chromosomes were affected in high-mosaic embryos. (b) Graphic representation of the incidence of aneuploidy observed in each chromosome for all human embryos used in the study and the surprisingly high frequency at which each chromosome is affected. (c) 3D plot displaying the correlation between the timing measurements of three parameters, the duration of the first cytokinesis, the interval between the first and second mitosis and the interval between the second and third mitosis and the underlying chromosomal composition of each imaged embryo. Embryos were categorized as euploid (green circles), triploid (aqua diamonds), low mosaic (red squares), high mosaic (downward pointing blue triangles), monosomy 22 (black asterisks), monosomy other (pink stars), trisomy 21 (upward pointing green triangles) and trisomy other (black plus signs) based on their A-CGH results. Note that all of the euploid embryos clustered together in a similar region as non-arrested or developmentally normal embryos in a previous report, whereas aneuploid embryos either overlapped with euploid embryos or accumulated at or close to zero for the second cell cycle parameter; n=45.
Figure 2
Figure 2. Association between embryonic aneuploidy and cellular fragmentation.
(a) The last frame of a time-lapse imaging sequence taken from an embryo with (left—indicated by white arrow) and without (right) fragmentation corresponding to the chromosomal composition outlined in Supplementary Table S2a and S2b, respectively. (b) Euploid embryos with (red squares) and without (green circles) fragmentation, aneuploid embryos with (blue triangles) and without (aqua diamonds) fragmentation and triploid embryos with (black asterisks) and without (pink stars) fragmentation were graphed in a 3D plot. Although fragmentation was detected in only one euploid embryo, the majority of both aneuploid and triploid embryos exhibited fragmentation; n=45. (c) Substantial overlap between embryos predicted to form blastocysts that do or do not exhibit fragmentation as illustrated in a 3D plot of blastocyst prediction with (red squares) and without (green circles) fragments (frags) and no blastocyst prediction with (blue triangles) and without (aqua diamonds) fragmentation. (d) A 3D plot demonstrating that in contrast to triploid embryos with fragmentation (aqua diamonds) and those with meiotic errors and fragmentation (red triangles), with the exception of one embryo with a meiotic error, only embryos with mitotic errors and fragmentation (blue plus signs) cluster near euploid embryos (green circles); n=32.
Figure 3
Figure 3. Evidence for the sequestering of chromosomes within cellular fragments.
(a) 3D plot showing the relationship between correct chromosome copy number defined as two copies of each chromosome per blastomere minus fragmentation (frags; green circles) or plus fragmentation (aqua diamonds) and incorrect chromosome copy number minus fragmentation (red squares) or plus fragmentation (blue triangles). Note that fragmentation may be used to identify embryos with abnormal chromosome number(s) that exhibit normal parameter timing; n=23. (b) FISH analysis of a single blastomere shown by the dashed box from a cleavage-stage embryo exhibiting cellular fragmentation and visualized by DIC (top) and confocal microscopy (bottom left and right). Two FISH signals for chromosome 16 were detected in the primary nucleus of the blastomere (bottom left; indicated by white solid arrow) stained with DAPI in the merged image (bottom right), but also one chromosome 16 signal was observed outside the primary nucleus of the blastomere (shown by white dashed arrow). (c) Similar FISH analysis of an individual blastomere indicated by the dashed box from an embryo without fragmentation (left) showing 1–2 copies of chromosome 21 (middle) in a small nuclear structure distinct from the primary nucleus of the blastomere (right). Scale bar, 50 μm.
Figure 4
Figure 4. Detection and developmental consequences of embryonic micronuclei.
(a) LAMIN-B1 (green) and CENP-A (orange) expression in DAPI-stained (blue) cleavage-stage human embryos by confocal microscopy reveals chromosome-containing micronuclei in the blastomeres of human embryos (shown by white arrows), (b) but not in mouse embryos also stained with Mitotracker Red. (c) Detection of embryonic micronuclei by LAMIN-B1 immunostaining in human embryos with abnormal cell cycle parameters, (d) but not in those with normal parameter timing. (e) 3D plot showing the effects of micronuclei on the cell cycle parameters and embryo developmental potential. Note that embryos without micronuclei (green circles) tightly cluster in a region similar to embryos with normal A-CGH profiles, whereas those embryos with micronuclei (blue triangles) exhibit more diverse parameter clustering when graphed; n=8. Scale bar, 50 μm.
Figure 5
Figure 5. Fragmentation timing suggests an embryo response to chromosomal abnormalities.
(a) Individual frames indicated by numbers taken from a time-lapse imaging sequence (Supplementary Movie 4) of an embryo with fragmentation demonstrating the fusion of a cellular fragment with an embryonic blastomere, which helps explain the complexity and incongruence of aneuploidy detected in human embryonic blastomeres. (b) Numbered imaging frames from Supplementary Movie 6 showing the incidence of cellular fragmentation following completion of the first cytokinesis. (c) Proposed model for the origin of human embryonic aneuploidy based on fragmentation timing, fragment resorption and underlying chromosomal abnormalities. Human embryos with meiotic errors (monosomies and trisomies) and those that appear to be triploid typically exhibit fragmentation at the one-cell stage (Supplementary Movie 5), whereas fragmentation is most often detected at the two-cell stage in embryos with mitotic errors (Supplementary Movie 6). We also demonstrate that missing chromosome(s) are contained within fragments (Supplementary Fig. S9a) termed embryonic micronuclei and for those embryos with mitotic errors, propose that the embryo likely divided before these chromosomes properly aligned on the mitotic spindle. The correlation between the timing of fragmentation and the type of embryonic aneuploidy suggests that the embryo may respond to chromosomal abnormalities and undergoes fragmentation as a survival mechanism. As development proceeds, these fragments either remain or are reabsorbed by the blastomere from which they originated or a neighbouring blastomere to generate the complex human aneuploidies observed (Supplementary Movie 4). (d) 3D plot showing the relationship between the timing of fragmentation and the cell cycle imaging parameters. Note that fragmentation, which is observed at the one-cell stage or later in development at the three to four-cell stage has more detrimental effects on the imaging parameters than fragmentation that occurs at the two-cell stage; n=32.
Figure 6
Figure 6. Automated tracking of cellular fragmentation for embryo assessment.
(a) Time sequence of cumulative segment lengths in pixels for each frame of the time-lapse image analysis for embryo C3 with high fragmentation, embryo B2 with low fragmentation and embryo C1 with no fragmentation shown in Supplementary Movie 1. Note that the embryo with high fragmentation exhibits much larger cumulative length of segments than that of embryos with low or no fragmentation. The alphanumeric labels of these embryos refer to the corresponding microwell identification labels. (b) Scatter plot of fragmentation scores for 14 of the 16 embryos (two embryos were excluded from the analysis for technical reasons) shown in Supplementary Movie 7 based on manual measurement of fragmentation degree. The fragmentation score is the cumulative sum of all segment lengths <10 pixels across all imaging sequences of each embryo. Although there is partial overlap in the fragmentation score between embryos with no or low fragmentation, the automated fragmentation detector validates the degree of the fragmentation measured manually. (c) The last frame of an image sequence compiled into a time-lapse movie (Supplementary Movie 7) overlaid with the automatic fragmentation analysis.
Figure 7
Figure 7. Summary model of human embryonic aneuploidy.
Embryonic development was monitored by time-lapse imaging from the one- to four-cell stage followed by assessment of chromosomal composition of each blastomere in the imaged embryos. We observed refinement of diagnostic non-invasive cell cycle parameters, determined the correlation with meiotic (monosomies and trisomies) and mitotic (high and low mosaic) errors and demonstrated an association between the cell cycle parameters and embryo morphology (fragmentation and blastomere asymmetry). We also suggest clinical value of parameter analysis with and without automated fragmentation assessment.

References

    1. Wong C. et al. Non-invasive imaging of human embryos before embryonic genome activation predicts development to the blastocyst stage. Nat. Biotechnol. 28, 1115–1121 (2010). - PubMed
    1. Dobson A. T. et al. The unique transcriptome through day 3 of human preimplantation development. Hum. Mol. Genet. 13, 1461–1470 (2004). - PubMed
    1. Zhang P. et al. Transcriptome profiling of human preimplantation development. PLoS One 4, e7844 (2009). - PMC - PubMed
    1. Galan A. et al. Functional genomics of 5- to 8-cell stage human embryos by blastomere single-cell cDNA analysis. PLoS One 5, e13615 (2010). - PMC - PubMed
    1. Vanneste E. et al. Chromosome instability is common in human cleavage-stage embryos. Nat. Med. 15, 577–583 (2009). - PubMed

Publication types

Supplementary concepts