. 2013 Feb 21;121(8):1255-64.
doi: 10.1182/blood-2012-06-434407. Epub 2012 Dec 4.

In vivo generation of transplantable human hematopoietic cells from induced pluripotent stem cells

Affiliations

In vivo generation of transplantable human hematopoietic cells from induced pluripotent stem cells

Giovanni Amabile et al. Blood. .

Abstract

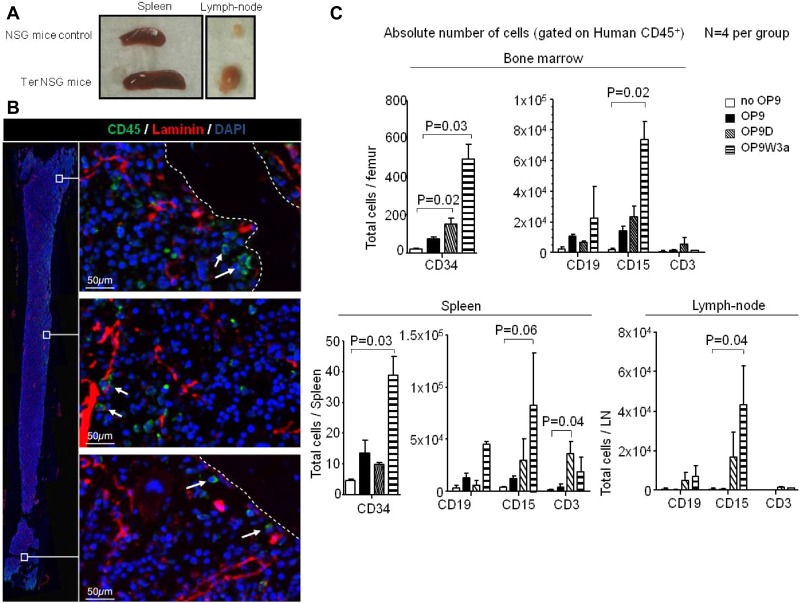
Lineage-restricted cells can be reprogrammed to a pluripotent state known as induced pluripotent stem (iPS) cells through overexpression of 4 transcription factors. iPS cells are similar to human embryonic stem (hES) cells and have the same ability to generate all the cells of the human body, including blood cells. However, this process is extremely inefficient and to date has been unsuccessful at differentiating iPS into hematopoietic stem cells (HSCs). We hypothesized that iPS cells, injected into NOD.Cg-Prkdc(scid) Il2rg(tm1Wjl)/SzJ immunocompromised (NSG) mice could give rise to hematopoietic stem/progenitor cells (HSPCs) during teratoma formation. Here, we report a novel in vivo system in which human iPS cells differentiate within teratomas to derive functional myeloid and lymphoid cells. Similarly, HSPCs can be isolated from teratoma parenchyma and reconstitute a human immune system when transplanted into immunodeficient mice. Our data provide evidence that in vivo generation of patient customized cells is feasible, providing materials that could be useful for transplantation, human antibody generation, and drug screening applications.


Figures

Figure 1
Figure 1
Active hematopoiesis occurs during teratoma formation. (A) Teratoma section stained with hematoxylin/eosin shown at 10× magnification demonstrating typical teratoma bone marrow–like structures. Trabecular bone, cartilage, and bone marrow are clearly visualized. (B) 60× magnification showing blood elements including neutrophils, lymphocytes, megakaryocytes (MK), and immature blasts (HSPCs) in the bone marrow–like island. (C) LSC showing the presence of human CD45+ blood cells (green) and CD34+CD45+ blood stem/progenitors cells (red and green) indicated by white arrows (right panels, 40× objective, scale bar 20 μm), within the context of an entire teratoma section (left panel, 10× objective, scale bar 500 μm). The profile of intensity in each fluorescent channel along the midline of each cell demonstrates the overlap of the red (CD34) and green (CD45 signals) around DAPI+ (blue) stained nuclei (middle panels).
Figure 2
Figure 2
OP9 stroma cells increase intra-teratoma hematopoiesis. (A) OP9-GFP+ cells were injected with iPS cells to generate teratomas. After 8 weeks, teratomas showed the presence of GFP+ cells in the parenchyma. (B) FACS analysis reveals the presence of blood progenitor/stem cells, myeloid cells, B, T cells, and glycophorin+ erythroid cells in the teratoma parenchyma. The percentage of each population is indicated for a representative teratoma derived by co-injection of iPS cells with OP9D. The glycophorin+ population shown as the percentage compared with the total teratoma cell number. (C) Quantitative FACS analysis of different blood populations during teratoma formation when iPS were injected in NSG mice or co-injected with OP9 cells or OP9 ectopically expressing Delta-like1 (OP9D) or Wnt3A (OP9W3a). Error bars represent SD.
Figure 3
Figure 3
Human blood cells colonize murine hematopoietic and lymphoid tissues. (A) Examples of spleen and lymph nodes of NSG wild-type mouse and NSG carrying 8-week-old teratomas. (B) LSC of femur bone of NSG mice carrying 8-week-old teratoma. The image on the left is the result of merging several images to give the reader a spatial reference of the areas in the femoral cavity from which the high resolution images on the right were obtained. White arrows indicate human CD45+ positive cells (green), whereas mouse laminin is stained red. Femurs of wild-type NSG mice and a secondary IgG were used as negative controls.
Figure 4
Figure 4
In vivo capacity of blood progenitor/stem cells arising in teratomas. (A) Schematic model for in vitro differentiation and in vivo transplantation of CD45+CD34+ isolated from teratoma. (B) CFU assay revealed the capability of CD45+CD34+ cells to give rise mostly to GM and M colonies. Few E− colonies were also detected. (C) Graph representing human chimerism of CD45+ cells in NSG recipient bone marrow. Three mice per group were transplanted with a different range of human CD45+CD34+ cells isolated from CB and teratoma as indicated. An additional 3 mice were injected with saline solution and used as negative controls. The percentage of human CD45+ cells over total mononuclear cells in bone marrow is shown in the y-axis. (D) Representative FACS analysis showing teratoma and cord blood human CD45+ and human CD34+CD45+ HSPCs populations in NSG recipient bone marrow. (E) Bar-graph showing multi-lineage reconstitution of a NSG bone marrow transplanted with human CD34+CD45+ cells derived from teratomas (Ter) and from cord blood (CB). (F-G) Primary and secondary multi-lineage reconstitution of murine organs by human CD34+CD45+ teratoma cells. For all the transplantation experiments mice injected with saline solution were used as negative control of the experiment. Isotype antibodies were used for gates settings and as additional control. Error bars represent SD. (H) Human-specific PCR of mtDNA shows that human cells are present in engrafted animals. Lane 1: DNA ladder markers. Lanes 2-4: specificity of the assay: human PCR primers efficiently amplify human DNA (lane 4) and do not amplify mouse DNA (lane 2). The latter control is essential as test samples (lanes 5-10) do contain some mouse DNA. Lane 3: validation of the mouse DNA control. The same sample as in lane 2 is successfully amplified with mouse PCR primers to confirm the presence of amplifiable mouse DNA. Lanes 5-7: amplification of FACS-purified human CD45+ cells derived from teratomas isolated from transplanted animals. Lanes 8-9: amplification of FACS-purified human CD34+CD45+ cells derived from teratomas isolated from transplanted animals. Lane 10: amplification of FACS-purified human CD34+CD45+ cells derived from CB isolated from transplanted animals. All the amplifications were performed using human-specific primers which confirm the presence of human cells in the engrafted animals.
Figure 5
Figure 5
Functionality of B and T-cell lineages derived from teratoma. (A) ELISA assay showing CD19+ B cells-Ter produce NS5 IgG and total human IgG in amounts comparable with those produced by CD19+ cells isolated from human peripheral blood (left panel). Murine CD19+ B cells were isolated and cultured in the same conditions and used as negative control (middle panel). CD19+ B cells derived from transplanted Ter and CB-CD34+CD45+ produce a similar total human IgGs (right panel). Absorbency at 450 nm is shown in the y-axis. (B) Typical CD3+ T cellsTer morphology after isolation from teratoma parenchyma and culture with IL-2 and anti-CD3 beads. (C) Quantitative cytokine assay showing that T cellsTer produce cytokines when stimulated with IL-2 and anti-CD3 beads. The amounts of cytokines secreted were comparable with those secreted by the same number of CD3+ cells isolated from human peripheral blood (left panel). CD3+ T cells isolated from NSG transplanted with cord blood and teratoma HSPCs were isolated from murine spleens after 60 days of transplantation and evaluated for cytokine production (right panel). Error bars represent SD for both experiments. (D) Fluorescents latex bead-phagocytosis assay for CD15+ cells derived from teratoma (Ter) and of CD15+ derived from human PB. The right panel shows representative CD15+ cells after immunofluorescent bead uptake.

Comment in

References

    1. Takahashi K, Yamanaka S. Induction of pluripotent stem cells from mouse embryonic and adult fibroblast cultures by defined factors. Cell. 2006;126(4):663–676. - PubMed
    1. Maherali N, Sridharan R, Xie W, et al. Directly reprogrammed fibroblasts show global epigenetic remodeling and widespread tissue contribution. Cell Stem Cell. 2007;1(1):55–70. - PubMed
    1. Wernig M, Meissner A, Foreman R, et al. In vitro reprogramming of fibroblasts into a pluripotent ES-cell-like state. Nature. 2007;448(7151):318–324. - PubMed
    1. Takahashi K, Tanabe K, Ohnuki M, et al. Induction of pluripotent stem cells from adult human fibroblasts by defined factors. Cell. 2007;131(5):861–872. - PubMed
    1. Nakagawa M, Koyanagi M, Tanabe K, et al. Generation of induced pluripotent stem cells without Myc from mouse and human fibroblasts. Nat Biotechnol. 2008;26(1):101–106. - PubMed

Publication types

MeSH terms