. 2013 Jan 25;288(4):2756-66.
doi: 10.1074/jbc.M112.427336. Epub 2012 Dec 4.

Toll-like receptor agonists and febrile range hyperthermia synergize to induce heat shock protein 70 expression and extracellular release

Affiliations

Toll-like receptor agonists and febrile range hyperthermia synergize to induce heat shock protein 70 expression and extracellular release

Aditi Gupta et al. J Biol Chem. .

Abstract

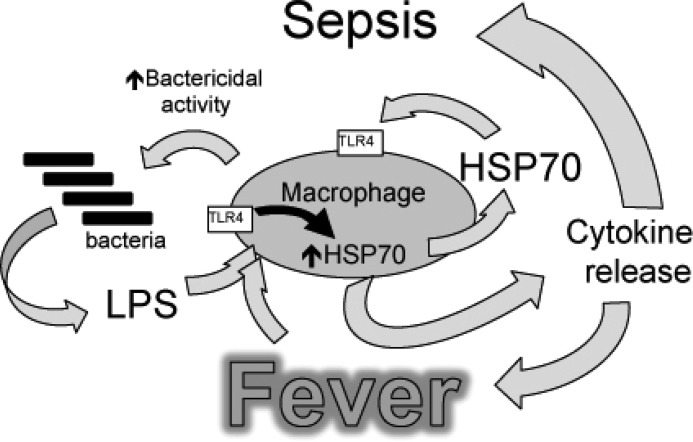
Heat shock protein (Hsp) 70 expression can be stimulated by febrile range temperature (FRT). Hsp70 has been shown to be elevated in serum of patients with sepsis, and when released from cells, extracellular Hsp70 exerts endotoxin-like effects through Toll-like receptor 4 (TLR4) receptors. Circulating TLR agonists and fever both persist for the first several days of sepsis, and each can activate Hsp70 expression; however, the effect of combined exposure to FRT and TLR agonists on Hsp70 expression is unknown. We found that concurrent exposure to FRT (39.5 °C) and agonists for TLR4 (LPS), TLR2 (Pam3Cys), or TLR3 (poly(IC)) synergized to increase Hsp70 expression and extracellular release in RAW264.7 macrophages. The increase in Hsp70 expression was associated with activation of p38 and ERK MAP kinases, phosphorylation of histone H3, and increased recruitment of HSF1 to the Hsp70 promoter. Pretreatment with the p38 MAPK inhibitor SB283580 but not the ERK pathway inhibitor UO126 significantly reduced Hsp70 gene modification and Hsp70 expression in RAW cells co-exposed to LPS and FRT. In mice challenged with intratracheal LPS and then exposed to febrile range hyperthermia (core temperature, ∼39.5 °C), Hsp70 levels in lung tissue and in cell-free lung lavage were increased compared with mice exposed to either hyperthermia or LPS alone. We propose a model of how enhanced Hsp70 expression and extracellular release in patients concurrently exposed to fever and TLR agonists may contribute to the pathogenesis of sepsis.


Figures

FIGURE 1.
FIGURE 1.
Proinflammatory agonists augment hyperthermia-induced Hsp70 expression in RAW cells. A, RAW cells were incubated with or without 100 ng/ml LPS at 37 °C or at 39.5 °C for 2 or 4 h and Hsp70 mRNA was measured by real time PCR, expressed as a ratio to GAPDH levels, and standardized to untreated 37 °C base-line levels. The results are the means ± S.E. of four experiments. * and † denote p < 0.05 versus 37 °C controls with no LPS and 39.5 °C cells with no LPS at the same time point, respectively. B and C, RAW cells were incubated with 100 ng/ml LPS, 0.5 μg/ml Pam3CSK4 (Pam3C), or 12.5 μg/ml poly(IC) (pI:C) at 39.5 °C for 6 h (B) or were exposed to HS at 42 °C for 2 h, recovered at 37 °C for 4 h (C), lysed, and immunoblotted for Hsp70 and β-tubulin. Lane 1 is untreated 37 °C control. D, A549 cells were incubated with or without 1 ng/ml IL-1β at 37 or 39.5 °C for 6 h, lysed, and immunoblotted for Hsp70 and β-tubulin. Immunoblots are representative of four independent experiments.
FIGURE 2.
FIGURE 2.
Proinflammatory agonists induce HSF1 phosphorylation in RAW cells. A, RAW cells were incubated with 100 ng/ml LPS at 37 °C for the indicated time, lysed, and immunoblotted for HSF1 to analyze electrophoretic mobility shift. B and C, lysates from RAW cells exposed to LPS for 30 min were incubated with or without (mock) shrimp alkaline phosphatase (SAP) for 30 min and then immunoblotted for HSF1 (B) or were resolved by two-dimensional gel electrophoresis using a pH 3–10 IPG strip for the first dimension and a 10% SDS gel for the second dimension and then immunoblotted for HSF1 (C). D, RAW cells were treated with 100 ng/ml LPS, 12.5 ng/ml poly(IC) (pI:C), or 0.5 μg/ml Pam3CSK4 (Pam3C) with or without 20 μg/ml polymyxin B, and lysates were immunoblotted for HSF1. Lane 1 is untreated 37 °C control. Immunoblots are representative of four independent experiments.
FIGURE 3.
FIGURE 3.
LPS and FRT synergistically induce HSF1 recruitment to the HSPA1A promoter. A, RAW cells were incubated at 37 or 39.5 °C with or without 100 ng/ml LPS, and nuclear extracts were analyzed for in vitro HSF1 DNA binding activity by EMSA. Lane 1 is probe alone. Lane 2 is nuclear extract from untreated 37 °C RAW cells. B, for supershift and competition assays nuclear extracts from 39.5 °C exposed cells in EMSA reaction were preincubated for 30 min on ice before addition of the radiolabeled probe with the following: none (lane 1), IgG (lane 2), supershifting anti-HSF1 antibody (lane 3), nonspecific double-stranded oligonucleotide probe (lane 4), and 10-fold excess of unlabeled HSF1 probe (lane 5). C, RAW cells were incubated at 37 or 39.5 °C with or without 100 ng/ml LPS for 60 min and formaldehyde-cross-linked, and HSF1 ChIP assay was performed. DNA was quantified by real time PCR using specific primers spanning the HSF1-binding site on the HSPA1A gene and presented as fold enrichment compared with control IgG immunoprecipitates. The values are the means ± S.E. (n = 4). * and † denote p < 0.05 versus 37 and 39.5 °C cells without LPS.
FIGURE 4.
FIGURE 4.
LPS and FRT synergistically increase histone H3 phosphorylation and recruitment to HSPA1A chromatin. A and B, RAW cells were incubated with or without 100 ng/ml LPS at 37 or 39.5 °C for 1 h and cross-linked with formaldehyde, and ChIP assay was performed using anti-phospho-histone H3 (Ser10) (A) or anti-histone H3 (B) antibody. Immunoprecipitated DNA was quantified by real time PCR using specific primers spanning the HSF1-binding site on the HSPA1A gene, and the fold enrichment compared with control IgG immunoprecipitates was calculated. The values are the means ± S.E. (n = 4). * and † denote p < 0.05 versus untreated 37 °C cells and untreated 39.5 °C cells, respectively. C, RAW cells were incubated at 39.5 °C with 100 ng/ml LPS for the indicated time, and lysates were immunoblotted for phospho-p38 (p) and total p38 (t) and ERK. Lane 1 is untreated 37 °C control cells. D, RAW cells were preincubated with ERK (U0126) or p38 (SB203580; SB) inhibitors for 30 min and then with 100 ng/ml LPS for 30 min at 39.5 °C, and the lysates were immunoblotted for phosphorylated (p) and total (t) RSK and MK2. Lane 1 is from untreated 37 °C control cells. Immunoblots are representative of four independent experiments. E, RAW cells were pretreated for 30 min at 37 °C with 10 μm UO126 or SB203580-hydrochloride (SB) or dimethyl sulfoxide (DMSO) and then stimulated with 100 ng/ml LPS for 2 h at 39.5 °C, and Hsp70 mRNA levels were measured by real time PCR and expressed as fold change versus untreated 37 °C control. F, RAW cells were pretreated with inhibitors as in C and then incubated with 100 ng/ml LPS at 37 or 39.5 °C for 6 h, and lysates were immunoblotted for Hsp70 and β-tubulin, quantified, and expressed as the Hsp70:β-tubulin ratio. The values are the means ± S.E. (n = 4). *, †, and ‡ denote p < 0.05 versus untreated (without LPS) 39.5 °C control, cells treated with LPS and U0126 or Me2SO, and similarly treated 37 °C cells. G, RAW cells were pretreated with or without 10 μm SB203580 hydrochloride for 30 min at 37 °C, and phospho-histone H3 ChIP assay was performed as describe above. * and † denote p < 0.05 versus untreated 37 °C and 39.5 °C cells without SB203580, respectively.
FIGURE 5.
FIGURE 5.
p38α knockdown reduces LPS-activated Hsp70 expression at FRT. RAW cells were transfected with scrambled negative control siRNA (scramb) or 50 or 100 pmol of p38α (MAPK14) siRNA and 48 h later either immunoblotted for p38α (A) or treated with 100 ng/ml LPS at 39.5 °C for 6 h and immunoblotted for Hsp70 and β-tubulin (B). Ratios from four independent experiments were plotted (C). The data are presented as the means ± S.E. *, p < 0.05.
FIGURE 6.
FIGURE 6.
LPS synergizes with FRT and HS for extracellular release of Hsp70 from RAW cells. RAW cells were incubated with 0, 100, or 1000 ng/ml LPS at 37 or 39.5 °C for 6 h (A and E) or 24 h (B) or exposed to a 42 °C HS for 2 h and then incubated at 37 °C for an additional 4 h (C and E) or 22 h (D). Cell culture supernatants were collected and cleared by centrifugation, and Hsp70 was quantified by ELISA and presented as pg/ml (A–D), or LDH activity was measured (6 h) and presented as A490 of the reaction product (E). The data are presented as the means ± S.E. (n = 4). * and † denote p < 0.05 versus similarly treated 37 °C cells and 39.5 °C cells with no LPS or HS-exposed cells, respectively.
FIGURE 7.
FIGURE 7.
LPS augments hyperthermia-induced Hsp70 expression in mouse lungs. A, mice implanted with intraperitoneal thermistors were housed at either 25 °C (normothermic, NT) or 36–37 °C (hyperthermic, HT) ambient temperature and core temperature measured every 20 s. The mean temperatures for each 2-h period were calculated, and the means ± S.E. are shown (n = 4); the two groups were different with p < 0.05 by multifactorial analysis of variance. B and C, mice were intratracheally instilled with LPS or sterile PBS (control) and housed under normothermic or hyperthermic conditions for 24 h. The lungs were excised, and the homogenates were immunoblotted for Hsp70 and expressed as a ratio to β-actin (B), or lungs were lavaged and Hsp70 quantified by ELISA (C). The data are the means ± S.E. (n = 4). *, †, and § denote p < 0.05 versus PBS-treated NT controls, PBS-treated HT mice, and LPS-treated NT mice, respectively.
FIGURE 8.
FIGURE 8.
Model of how fever, LPS, and Hsp70 interact to cause sepsis. Proposed model of sepsis in which LPS and fever initiate a positive feedback pathway through enhanced Hsp70 expression and release and subsequent increased TLR4 activation, Hsp70 expression, and proinflammatory cytokine release.

Similar articles

Cited by

References

    1. Sriskandan S., Altmann D. M. (2008) The immunology of sepsis. J. Pathol. 214, 211–223 - PubMed
    1. Bianchi M. E. (2007) DAMPs, PAMPs and alarmins. All we need to know about danger. J. Leukocyte Biol. 81, 1–5 - PubMed
    1. Andersson U., Wang H., Palmblad K., Aveberger A. C., Bloom O., Erlandsson-Harris H., Janson A., Kokkola R., Zhang M., Yang H., Tracey K. J. (2000) High mobility group 1 protein (HMG-1) stimulates proinflammatory cytokine synthesis in human monocytes. J. Exp. Med. 192, 565–570 - PMC - PubMed
    1. Shi Y., Evans J. E., Rock K. L. (2003) Molecular identification of a danger signal that alerts the immune system to dying cells. Nature 425, 516–521 - PubMed
    1. Zhang Q., Raoof M., Chen Y., Sumi Y., Sursal T., Junger W., Brohi K., Itagaki K., Hauser C. J. (2010) Circulating mitochondrial DAMPs cause inflammatory responses to injury. Nature 464, 104–107 - PMC - PubMed

Publication types