. 2013 Jan 18;288(3):1653-64.
doi: 10.1074/jbc.M112.417246. Epub 2012 Dec 4.

Mutations of the Ca2+-sensing stromal interaction molecule STIM1 regulate Ca2+ influx by altered oligomerization of STIM1 and by destabilization of the Ca2+ channel Orai1

Affiliations

Mutations of the Ca2+-sensing stromal interaction molecule STIM1 regulate Ca2+ influx by altered oligomerization of STIM1 and by destabilization of the Ca2+ channel Orai1

Tatiana Kilch et al. J Biol Chem. .

Abstract

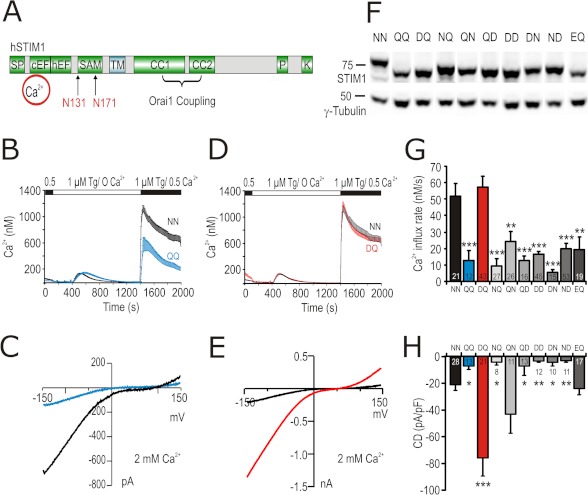
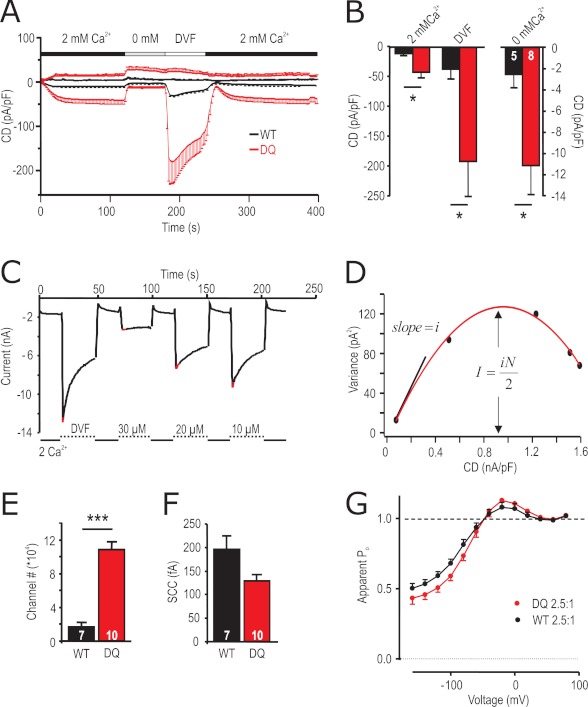
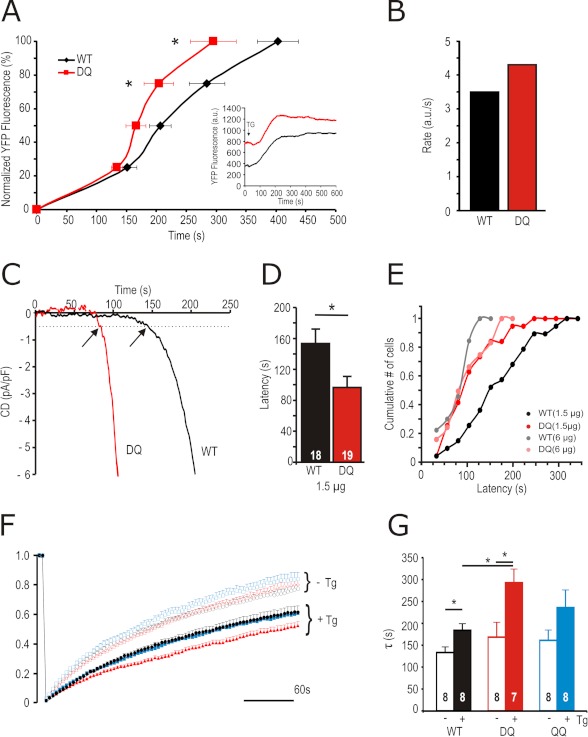
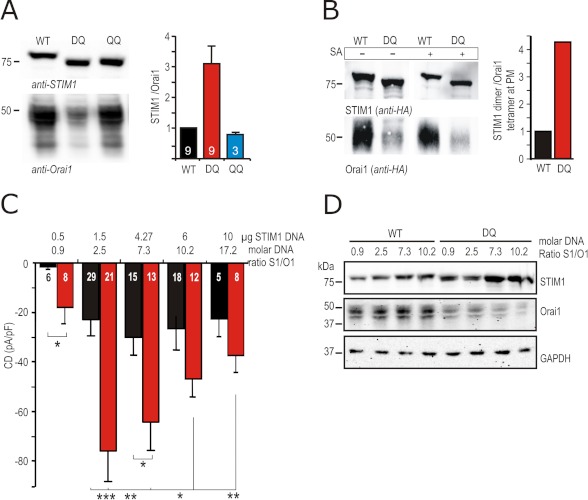
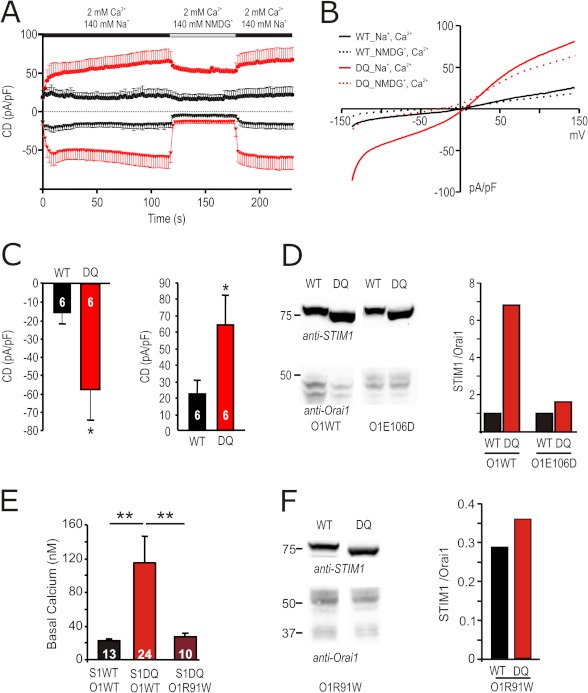
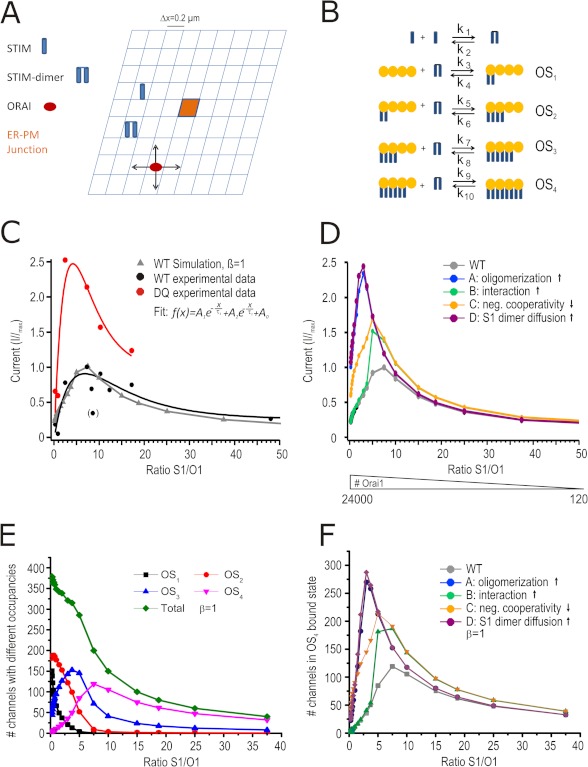
A drop of endoplasmic reticulum Ca(2+) concentration triggers its Ca(2+) ssensor protein stromal interaction molecule 1 (STIM1) to oligomerize and accumulate within endoplasmic reticulum-plasma membrane junctions where it activates Orai1 channels, providing store-operated Ca(2+) entry. To elucidate the functional significance of N-glycosylation sites of STIM1, we created different mutations of asparagine-131 and asparagine-171. STIM1 NN/DQ resulted in a strong gain of function. Patch clamp, Total Internal Reflection Fluorescent (TIRF) microscopy, and fluorescence recovery after photobleaching (FRAP) analyses revealed that expression of STIM1 DQ mutants increases the number of active Orai1 channels and the rate of STIM1 translocation to endoplasmic reticulum-plasma membrane junctions with a decrease in current latency. Surprisingly, co-expression of STIM1 DQ decreased Orai1 protein, altering the STIM1:Orai1 stoichiometry. We describe a novel mathematical tool to delineate the effects of altered STIM1 or Orai1 diffusion parameters from stoichiometrical changes. The mutant uncovers a novel mechanism whereby "superactive" STIM1 DQ leads to altered oligomerization rate constants and to degradation of Orai1 with a change in stoichiometry of activator (STIM1) to effector (Orai1) ratio leading to altered Ca(2+) homeostasis.


Figures

FIGURE 1.
FIGURE 1.
Mutations in STIM1 N-glycosylation sites modulate ICRAC. A, schematic representation of structural domains in STIM1 protein showing the two N-glycosylation sites (Asn-131 and Asn-171) within the luminal EF-SAM domain. SF, signal peptide; cEF, canonical EF-hand Ca2+-binding region; hEF, hidden EF-hand Ca2+-binding region; TM, transmembrane domain; CC1 and CC2, coiled-coil regions; P, proline-rich domain; K, lysine-rich domain. B, average [Ca2+]i responses before and following store depletion by the addition of 1 μm Tg and readdition of indicated [Ca2+]o (SOCE) in cells co-transfected with Orai1 and STIM1 WT (NN, black trace) or STIM1 N131Q/N171Q (QQ, blue trace). C, exemplary current-voltage (I/V) plot of ICRAC from whole cell recordings in cells transfected as in B. D, SOCE of cells expressing Orai1 and STIM1 WT (NN, black trace) or STIM1 N131D/N171Q (DQ, red trace). E, exemplary (I/V) plot of ICRAC from whole cell recordings in cells transfected as in D. F, immune blot of total cell lysates from cells expressing Orai1 and STIM1 WT or the corresponding mutant indicated above the blot. Letters stand for single amino acid codes at positions 131 and 171, respectively. G, average of Ca2+ influx rates obtained from SOCE measurements in cells transfected as in F. H, CD extracted at 110 s and −140 mV from whole cell recordings in cells transfected as in F.
FIGURE 2.
FIGURE 2.
Biophysical properties of STIM1 DQ-mediated Orai1 currents. A, average CD over time recorded from cells expressing Orai1 and STIM1 WT (black) or STIM1 DQ (red) extracted at +80 and −140 mV. Solution changes are indicated. B, averaged maximal inward CD for currents recorded in A in the different indicated external solutions. C, for noise analysis, currents were extracted at −120 mV in 2 mm [Ca2+] bath or in either DVF or in Mg2+-free bath with the indicated added [Ca2+]. D, current variance was extracted at indicated (red) time points in C and plotted against the CD. The red line indicates the fit using a parabolic function. E, number of channels as extracted from the maximum of the fit in D. F, single channel current (SCC) as extracted from the initial slope indicated in D. G, apparent measured open probability (Po) of Orai1 channels as a function of the applied voltage. The cells were held at 0 mV in a 2 mm Ca2+-containing solution and steps of 20 mV were applied from −160 to +80 mV over 100 ms followed by a step voltage to −100 mV. Boltzman equation was used to normalize the maximum tail current after each voltage step (see “Experimental Procedures”).
FIGURE 3.
FIGURE 3.
STIM1 DQ shows faster translocation to PM, activation kinetics, and altered diffusion following stimulation. A, traces of normalized (% of maximum) YFP fluorescence at the TIRF plane over time in cells expressing YFP-STIM1 WT (black) or STIM1 DQ (red) and Orai1-RFP. The inset shows the absolute change in fluorescence over time. B, rate of increase of YFP-fluorescence in cells measured in A, as calculated from fitting the averaged traces with a Hill function. C, exemplary traces showing kinetics of current development initiated by passive depletion in cells expressing Orai1 and STIM1 WT (black) or STIM1 DQ (red). The arrows indicate latencies defined as the time point when current size reaches 0.5 pA/pF. D, average latencies of STIM1 WT (black) and STIM1 DQ (red) measured in C. E, cumulative number of cells activated within time segments of 25 s obtained from recordings from cells transfected as in C or with 6 μg of STIM1 WT (gray) or STIM1 DQ (pink). F, traces showing YFP-STIM1 fluorescence recovery after photobleaching over time in cells expressing YFP-STIM1 WT (black circles), STIM1 DQ (red triangles), or STIM1 QQ (blue squares) with (closed) or without (open) pretreatment with Tg (see “Experimental Procedures” for analysis). G, average time constants (τ) of YFP fluorescence recovery from cells measured in F.
FIGURE 4.
FIGURE 4.
STIM1 DQ mutant down-regulates Orai1 protein and expression of different STIM1:Orai1 DNA ratios cannot mimic the STIM1 DQ phenotype. A, left panel, immune blot of lysates of cells expressing Orai1 and STIM1 WT/DQ/QQ. Detection with anti-STIM1 or anti-Orai1 antibodies. The right panel represents the quantification of STIM1 to Orai1 protein ratios obtained from several experiments, each normalized to the WT ratio of the corresponding experiment. B, left panel, immune blot of surface expressed (biotinylated) proteins in HEK cells expressing HA-tagged Orai1 and STIM1 WT or STIM1 DQ. 50 μg of protein (5% of total) was loaded in lanes 1 and 2; lanes 3 and 4 show the entire SA-retained fraction. Detection was done with anti-HA antibody. The quantification shown in the right panel was done as follows: (total input STIM1 a.u./2)/(SA retained Orai1 a.u./4). The ratio of STIM1 DQ was normalized to WT. C, CD measured and extracted as in Fig. 1H from cells transfected with 0.5 μg of Orai1 and different DNA amounts of STIM1 (μg of STIM1) WT (black) or STIM1 DQ (red) at molar ratios shown above the bar graphs. D, immune blot of lysates of cells transfected as in C; detection with anti-STIM1, anti-Orai1, and anti-GAPDH antibodies.
FIGURE 5.
FIGURE 5.
The Orai1 pore mutant E106D is amplified by, but largely protected against, STIM1 DQ-induced degradation. A, traces showing average CD over time recorded from cells transfected with 0.5 μg of Orai1 E106D and 1.5 μg of STIM1 WT (black) or STIM1 DQ (red) extracted at +120 and −140 mV. External solution was changed as shown in the bar above the traces. B, corresponding I/V plots from cells measured in A, extracted in Na+-containing (110 s, solid lines) and NMDG-containing (140 s, dotted lines) solution. C, CD in cells recorded in A, extracted in the Na+-containing solution after 110 s at −140 mV (left panel) or +120 mV (right panel). D, immune blot of lysates of cells transfected as in A or with 0.5 μg of Orai1WT together with 1.5 μg of STIM1WT or STIM1 DQ (left panel). Detection was done with the indicated antibodies, and STIM1/Orai1 protein ratios are quantified in the right panel. E, basal [Ca2+]i in cells transfected either with 0.5 μg of Orai1 WT or Orai1 R91W and 1.5 μg of STIM1 WT or STIM1 DQ as indicated below ([Ca2+]o 2 mm). F, immune blot of lysates of cells transfected as in E. Detection was done with the indicated antibodies, and STIM1/Orai1 protein ratios are quantified in the right panel.
FIGURE 6.
FIGURE 6.
STIM1 DQ phenotype can be simulated by a mathematical model. A, model geometry. The size of ER-PM junction is (0.2 μm)2. B, reaction scheme where OS(x) denotes one Orai1 tetramer with (x) STIM1 dimer bound with the corresponding reaction constants shown above the arrows. C, normalized stationary CD plotted against the STIM1/Orai1 ratio for measured STIM1 WT (black circles) and modeled (simulated) WT data (gray triangles) and for measured STIM1 DQ (red) normalized to measured WT maximum. D, normalized currents derived from the model plotted against S1/O1 ratio. The colors denote different STIM1 mutants (see text) normalized to Imax of model WT. The number of Orai1 entered into the model are noted below. E, number of channels with different occupancies plotted against S1/O1 ratio. F, number of OS4-bound channels for the different mutants plotted against S1/O1 ratio.

Similar articles

Cited by

References

    1. Hogan P. G., Lewis R. S., Rao A. (2010) Molecular basis of calcium signaling in lymphocytes: STIM and ORAI. Annu. Rev. Immunol. 28, 491–533 - PMC - PubMed
    1. Maul-Pavicic A., Chiang S. C., Rensing-Ehl A., Jessen B., Fauriat C., Wood S. M., Sjöqvist S., Hufnagel M., Schulze I., Bass T., Schamel W. W., Fuchs S., Pircher H., McCarl C. A., Mikoshiba K., Schwarz K., Feske S., Bryceson Y. T., Ehl S. (2011) ORAI1-mediated calcium influx is required for human cytotoxic lymphocyte degranulation and target cell lysis. Proc. Natl. Acad. Sci. U.S.A. 108, 3324–3329 - PMC - PubMed
    1. Qu B., Al-Ansary D., Kummerow C., Hoth M., Schwarz E. C. (2011) ORAI-mediated calcium influx in T cell proliferation, apoptosis and tolerance. Cell Calcium 50, 261–269 - PubMed
    1. Feske S., Gwack Y., Prakriya M., Srikanth S., Puppel S. H., Tanasa B., Hogan P. G., Lewis R. S., Daly M., Rao A. (2006) A mutation in Orai1 causes immune deficiency by abrogating CRAC channel function. Nature 441, 179–185 - PubMed
    1. Gwack Y., Srikanth S., Oh-Hora M., Hogan P. G., Lamperti E. D., Yamashita M., Gelinas C., Neems D. S., Sasaki Y., Feske S., Prakriya M., Rajewsky K., Rao A. (2008) Hair loss and defective T- and B-cell function in mice lacking ORAI1. Mol. Cell Biol. 28, 5209–5222 - PMC - PubMed

Publication types

MeSH terms