. 2013 Feb 1;288(5):3003-15.
doi: 10.1074/jbc.M112.418467. Epub 2012 Dec 4.

Regulation of the G-protein regulatory-Gαi signaling complex by nonreceptor guanine nucleotide exchange factors

Affiliations

Regulation of the G-protein regulatory-Gαi signaling complex by nonreceptor guanine nucleotide exchange factors

Sukru Sadik Oner et al. J Biol Chem. .

Abstract

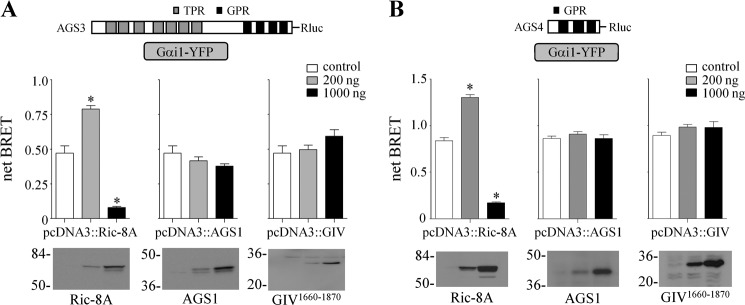
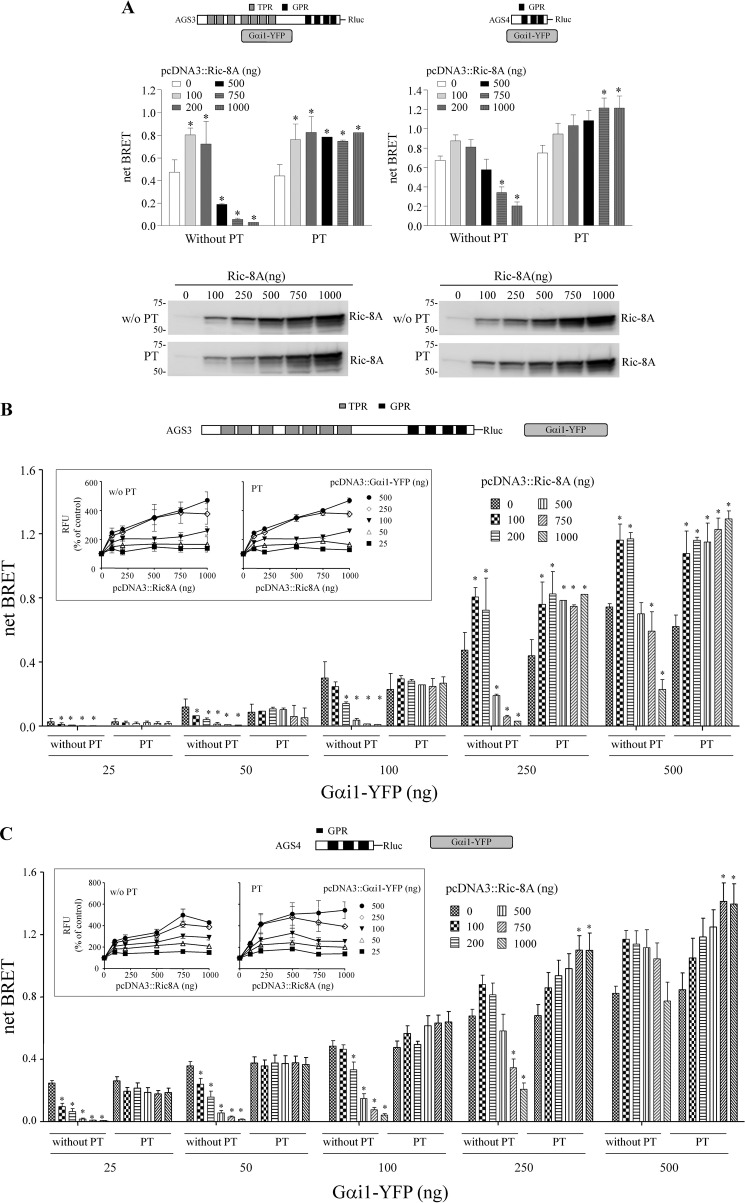
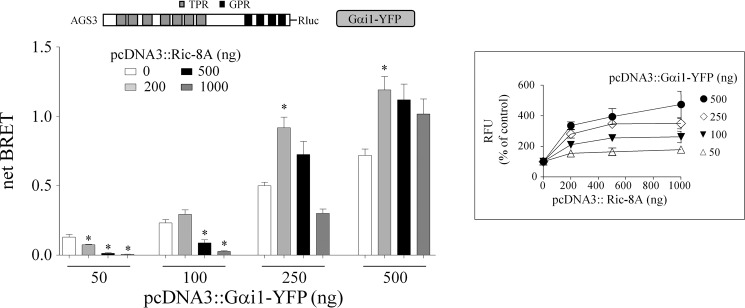
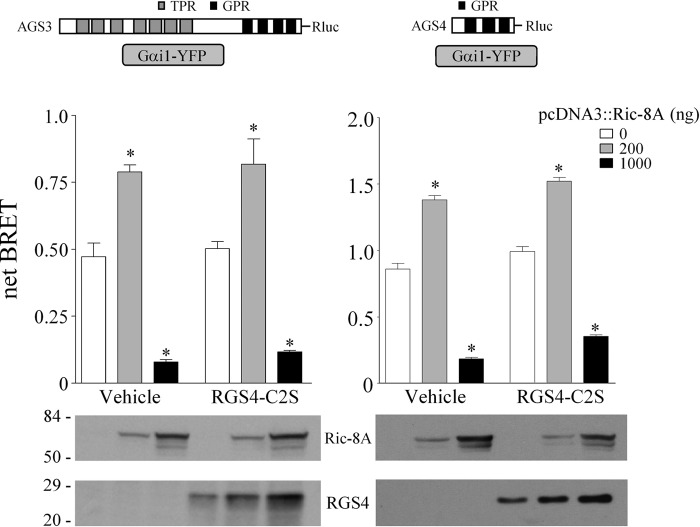
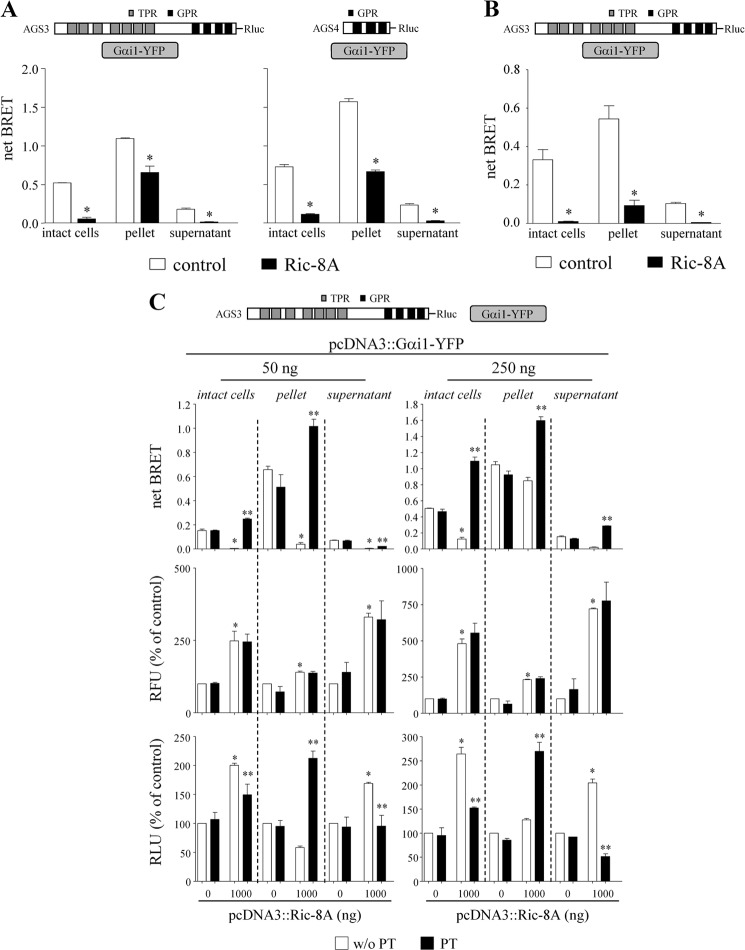
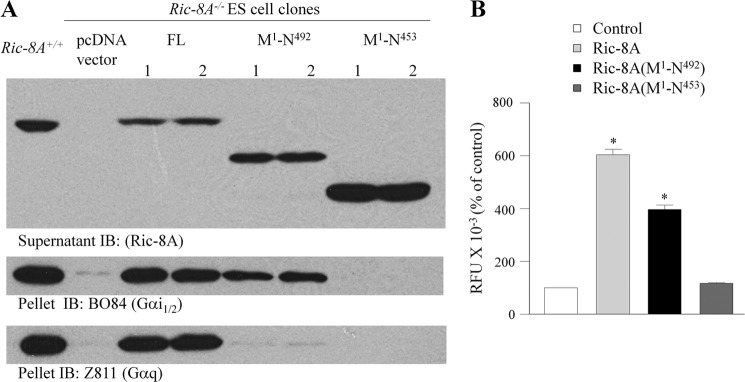
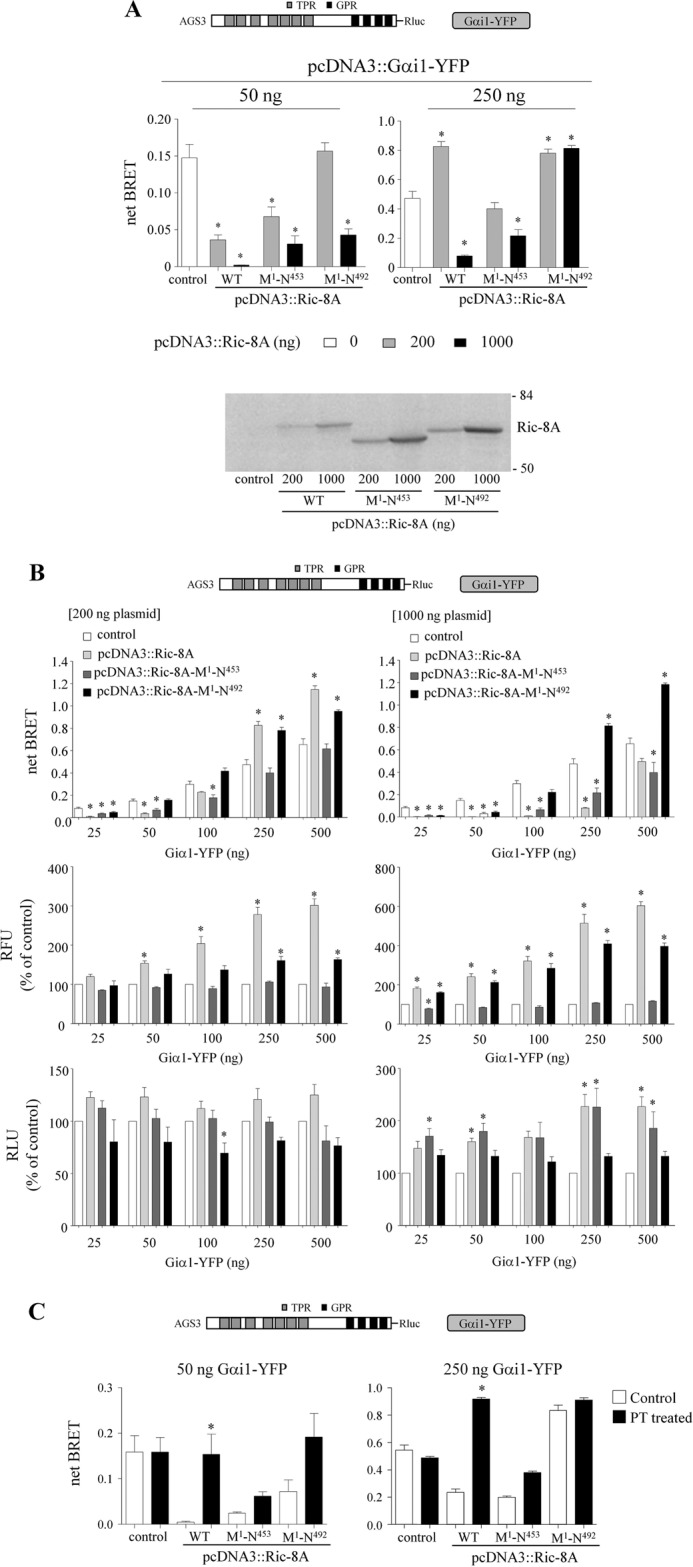
Group II activators of G-protein signaling (AGS) serve as binding partners for Gα(i/o/t) via one or more G-protein regulatory (GPR) motifs. GPR-Gα signaling modules may be differentially regulated by cell surface receptors or by different nonreceptor guanine nucleotide exchange factors. We determined the effect of the nonreceptor guanine nucleotide exchange factors AGS1, GIV/Girdin, and Ric-8A on the interaction of two distinct GPR proteins, AGS3 and AGS4, with Gα(il) in the intact cell by bioluminescence resonance energy transfer (BRET) in human embryonic kidney 293 cells. AGS3-Rluc-Gα(i1)-YFP and AGS4-Rluc-Gα(i1)-YFP BRET were regulated by Ric-8A but not by Gα-interacting vesicle-associated protein (GIV) or AGS1. The Ric-8A regulation was biphasic and dependent upon the amount of Ric-8A and Gα(i1)-YFP. The inhibitory regulation of GPR-Gα(i1) BRET by Ric-8A was blocked by pertussis toxin. The enhancement of GPR-Gα(i1) BRET observed with Ric-8A was further augmented by pertussis toxin treatment. The regulation of GPR-Gα(i) interaction by Ric-8A was not altered by RGS4. AGS3-Rluc-Gα(i1)-YFP and AGS4-Rluc-G-Gα(i1)-YFP BRET were observed in both pellet and supernatant subcellular fractions and were regulated by Ric-8A in both fractions. The regulation of the GPR-Gα(i1) complex by Ric-8A, as well as the ability of Ric-8A to restore Gα expression in Ric8A(-/-) mouse embryonic stem cells, involved two helical domains at the carboxyl terminus of Ric-8A. These data indicate a dynamic interaction between GPR proteins, Gα(i1) and Ric-8A, in the cell that influences subcellular localization of the three proteins and regulates complex formation.


Figures

FIGURE 1.
FIGURE 1.
Regulation of AGS3-Rluc-Gαi1-YFP and AGS4-Rluc-Gαi1-YFP BRET by nonreceptor GEFs. AGS3-Rluc (10 ng) (A) and AGS4-Rluc (2 ng) (B) were expressed together with Gαi1-YFP (250 ng) in HEK cells, and BRET was measured as described under “Experimental Procedures.” Ric-8A, AGS1, or GIV(1660–1870) was expressed as indicated. Data are presented as the mean ± S.E. from four experiments with triplicate determinations. *, p < 0.05 compared with control. The relative fluorescent units and relative luciferase units for sample points in A and B are presented in Table 1. Lower panels, Ric-8A, AGS1, and GIV(1660–1870) immunoblots. Ric-8A and AGS1 proteins were detected with affinity-purified anti-Ric-8A and anti-AGS1 antibody, respectively. GIV(1660–1870) was detected with anti-His6 antibody. Each lane contains 50 μg of total protein, and the immunoblot is representative of three separate experiments. The GIV construct (pcDNA3.1/His::GIV(1660–1870)) encoded the carboxyl-terminal region of the protein as described under “Experimental Procedures.”
FIGURE 2.
FIGURE 2.
Regulation of AGS3-Rluc-Gαi1-YFP and AGS4-Rluc-Gαi1-YFP BRET by Ric-8A. A, BRET data presented in A were extracted from the larger, complete datasets in B and C. Lower panels, 1% Nonidet P-40 lysates from HEK cells expressing AGS3-Rluc, AGS4-Rluc, and Gαi1-YFP (250 ng of plasmid) and increasing amounts of Ric-8A as in the upper panel were subjected to SDS-PAGE and immunoblotting with Ric-8A antisera. The immunoblot is representative of two similar experiments. The numbers to the right of the immunoblots correspond to the migration of prestained Bio-Rad protein standards. *, p < 0.05 compared with their control. For AGS3-Rluc (10 ng) (B) and AGS4-Rluc (2 ng) (C), increasing amounts of Gαi1-YFP (25–500 ng) and Ric-8A (as indicated in the figure) were expressed in HEK cells, and BRET was measured as described under “Experimental Procedures.” In some experiments, cells were pretreated with pertussis toxin (100 ng/ml) for 16 h. Data in B and C are presented as the mean ± S.E. from four to five experiments with triplicate determinations. *, p < 0.05 compared with their control. Relative fluorescence units (RFU) were measured for each sample in B and C as described under “Experimental Procedures.” Insets in B and C, data are presented as the percentage of control values (cells expressing only AGS3-Rluc and Gαi1-YFP). Results are expressed as the mean ± S.E. of four to five (B) or three (C) independent experiments with triplicate determinations. Inset for B, RFU values for control cells transfected with 25, 50, 100, 250, and 500 ng of pcDNA3::Gαi1-YFP were 41,729 ± 793, 65,720 ± 2,291, 98,810 ± 2,716, 150,534 ± 6,153, and 178,964 ± 5,871, respectively, and for PT-treated cells were 41,673 ± 2,445, 55,531 ± 3,899, 94,584 ± 6,931, 148,609 ± 5,501 and 160,708 ± 5,583, respectively. RFU values at each level of transfected pcDNA3::Gαi1-YFP, with or without PT, were significantly different (p < 0.05) from the corresponding control value with the exception of the RFU value for pcDNA3::Gαi1-YFP (25 ng), pcDNA3::Ric-8A (200 ng). C, RFU values for control cells transfected with 25, 50, 100, 250, and 500 ng of pcDNA3::Gαi1-YFP were 37,816 ± 1559, 42,803 ± 1,628, 55,727 ± 1,858, 75,420 ± 2,836 and 93,555 ± 5,158, respectively, and for PT-treated cells were 40,313 ± 2,031, 47,200 ± 3,208, 62,215 ± 4,841, 83,990 ± 6,741, and 111,044 ± 7,388, respectively. *, p < 0.05 compared with their control. RFU values at each level of transfected pcDNA3::Gαi1-YFP for PT-treated cells were significantly different (p < 0.05) from the corresponding control value with the exception of the RFU values the following samples: pcDNA3::Gαi1-YFP (25 ng), pcDNA3::Ric-8A (100, 750, and 1,000 ng); pcDNA3::Gαi1-YFP (50, 100, 250, and 500 ng), pcDNA3::Ric-8A (100 ng); pcDNA3::Gαi1-YFP (500 ng), pcDNA3::Ric-8A (200 ng).
FIGURE 3.
FIGURE 3.
Regulation of AGS3-Rluc-Gαi1-YFP BRET by Ric-8A in the neuronal catecholaminergic cell line (CAD). AGS3-Rluc (10 ng) was expressed together with Gαi1-YFP and Ric-8A as indicated, and BRET was measured as described under “Experimental Procedures.” Data are presented as the mean ± S.E. from three experiments with triplicate determinations. *, p < 0.05 compared with their control. Inset, data are presented as the percentage of control values (cells expressing only AGS3-Rluc and Gαi1-YFP). Results are expressed as the mean ± S.E. of four independent experiments with triplicate determinations. RFU values for control cells transfected with 10 ng of phRluc::AGS3 and 50, 100, 250, and 500 ng of pcDNA3::Gαi1-YFP were 21,969 ± 2,231, 24,097 ± 1,598, 35,383 ± 2,472, and 49,359 ± 4,926, respectively. RFU values at each level of transfected pcDNA3::Gαi1-YFP were significantly different (p < 0.05) from the corresponding control value with the exception of the RFU values for pcDNA3-Gαi1-YFP (50 ng), pcDNA3::Ric-8A (200 and 500 ng).
FIGURE 4.
FIGURE 4.
Effect of RGS4 on AGS3-Rluc-Gαi1-YFP and on AGS4-Rluc-Gαi1-YFP BRET. AGS3-Rluc (10 ng) (left panel) and AGS4-Rluc (2 ng) (right panel) were expressed in HEK cells with Gαi1-YFP (250 ng) in the presence and absence of Ric-8A, and BRET was measured as described under “Experimental Procedures.” RGS4-C2S (500 ng) was co-expressed as indicated. Data are presented as the mean ± S.E. from four experiments with triplicate determinations. *, p < 0.05 compared with their control. Lower panel, Ric-8A and RGS4 immunoblot. Each lane contains 50 μg of total protein, and the immunoblot is representative of two separate experiments.
FIGURE 5.
FIGURE 5.
Ric-8A regulates AGS3-Rluc-Gαi1-YFP and AGS4-Rluc-Gαi1-YFP BRET in both pellet and supernatant fractions. A, AGS3-Rluc (10 ng) and AGS4-Rluc (2 ng) were expressed in HEK cells with Gαi1-YFP (250 ng), and BRET was measured in intact cells, pellet, and supernatant as described under “Experimental Procedures.” Ric-8A was expressed as indicated. Results are expressed as the mean ± S.E. of three independent experiments with triplicate determinations. *, p < 0.05 compared with their control. B, AGS3-Rluc (10 ng) was expressed in the neuronal catecholaminergic cell line (CAD) together with Gαi1-YFP (50 ng) and Ric-8A as indicated, and BRET was measured as described under “Experimental Procedures.” Data are presented as the mean ± S.E. from three experiments with triplicate determinations. *, p < 0.05 compared with their control as determined by Student's t test. The relative fluorescent units and relative luciferase units for sample points in A and B are presented in Table 2. C, AGS3-Rluc (10 ng) and Gαi1-YFP (50 ng) (left panel) or Gαi1-YFP (250 ng) (right panel) in the presence and absence of Ric-8A (1,000 ng) were expressed in HEK cells, and BRET was measured in intact cells, pellet, and supernatant fractions prepared from control cells or cells pretreated with PT as described under “Experimental Procedures.” RFU and RLU are presented as the percentage of control values obtained in cells expressing only AGS3-Rluc and Gαi1-YFP. Results are expressed as the mean ± S.E. of two independent experiments with triplicate determinations. *, p < 0.05 Ric-8A versus control. **, p < 0.05 PT versus non-PT treated control. Basal levels of RFU and RLU for control cells were as follows: 50 ng of pcDNA3::Gαi1-YFP: intact cell RFU = 89,412 ± 837, RLU = 524,526 ± 115,170; pellet RFU = 61,037 ± 9,021, RLU = 182,237 ± 82,483; supernatant RFU = 28,810 ± 7,388, RLU = 455,064 ± 255,751. 250 ng of pcDNA3::Gαi1-YFP: intact cell RFU = 141,573 ± 6,692, RLU = 338,131 ± 75,783; pellet RFU = 113,476 ± 11,240, RLU = 204,852 ± 76,241; supernatant RFU = 41,276 ± 9,572, RLU = 204,829 ± 110,133.
FIGURE 6.
FIGURE 6.
Effect of carboxyl-terminal truncated Ric-8A on Gα expression. A, complementation assay in Ric-8A−/− murine embryonic stem cells. Ric-8A−/− ES cell clones stably expressing full-length Ric-8A, Ric-8A (Met1–Asn492), Ric-8A (Met1–Asn453), or pcDNA3.1 Hygro were lysed and fractionated into pellet and supernatant as described elsewhere (66). Equal protein from the fractions was immunoblotted (IB) for Ric-8A, Gαi1/2 (B084), and Gαq/11 (Z811). B, AGS3-Rluc (10 ng), Gαi1-YFP (500 ng), and Ric-8A WT, Ric-8A (Met1–Asn453), and Ric-8A (Met1–Asn492) (1000 ng) in pcDNA3 were expressed in HEK cells, and relative fluorescence units (RFU) were measured as described under “Experimental Procedures.” Results are expressed as the mean ± S.E. of four independent experiments with triplicate determinations. *, p < 0.05 compared with control.
FIGURE 7.
FIGURE 7.
Effect of truncated Ric-8A on AGS3-Rluc-Gαi1-YFP BRET. A, BRET data presented in A were extracted from the larger, complete datasets in B. *, p < 0.05, compared with its control. Lower panel, Ric-8A immunoblot. Each lane contains 50 μg of total protein, and the immunoblot presented is representative of three separate experiments. The numbers to the right of the immunoblots correspond to the migration of prestained Bio-Rad protein standards. B, AGS3-Rluc (10 ng), increasing amounts of Gαi1-YFP (25–500 ng) and Ric-8A WT, Ric-8A (Met1–Asn453), and Ric-8A (Met1–Asn492) (as indicated in the figures) were expressed in HEK cells, and BRET signals were measured as described under “Experimental Procedures.” Middle panel, RFUs for each sample are presented as the percentage of control values (cells expressing only AGS3-Rluc and Gαi1-YFP). RFU values for control cells transfected with 25, 50, 100, 250, and 500 ng of pcDNA3::Gαi1-YFP 50,476 ± 6,117, 62,489 ± 6,986, 87,708 ± 11,705, 120,783 ± 16,267, and 155,140 ± 20,720, respectively. Lower panel, RLU are presented as the percentage of control values obtained in cells expressing only AGS3-Rluc and Gαi1-YFP. Relative luminescence unit values for control cells transfected with 25, 50, 100, 250, and 500 ng of pcDNA3::Gαi1-YFP were 462,452 ± 134,067, 456,049 ± 110,347, 400,833 ± 100,309, 263,295 ± 52,793, and 207,460 ± 45,087, respectively. Results are expressed as the mean ± S.E. of four independent experiments with triplicate determinations. *, p < 0.05 compared with their control. C, effect of PT pretreatment on the regulation of AGS3-Rluc-Gαi1-YFP BRET by carboxyl-terminal truncated Ric-8A. AGS3-Rluc (10 ng) and Gαi1-YFP (50 ng) (left panel) or Gαi1-YFP (250 ng) (right panel) were expressed in HEK cells and BRET signals, RFU and RLU values were measured as described under “Experimental Procedures.” The relative fluorescent units and relative luciferase units are presented in Table 3. Ric-8A and truncated Ric-8A mutants were expressed as indicated. In some experiments, cells were pretreated with pertussis toxin (100 ng/ml) for 16 h. Results are expressed as the mean ± S.E. of three independent experiments with triplicate determinations. *, p < 0.05 compared with their control.

Similar articles

Cited by

References

    1. Cismowski M. J., Takesono A., Ma C., Lizano J. S., Xie X., Fuernkranz H., Lanier S. M., Duzic E. (1999) Genetic screens in yeast to identify mammalian nonreceptor modulators of G-protein signaling. Nat. Biotechnol. 17, 878–883 - PubMed
    1. Takesono A., Cismowski M. J., Ribas C., Bernard M., Chung P., Hazard S., 3rd, Duzic E., Lanier S. M. (1999) Receptor-independent activators of heterotrimeric G-protein signaling pathways. J. Biol. Chem. 274, 33202–33205 - PubMed
    1. Blumer J. B., Smrcka A. V., Lanier S. M. (2007) Mechanistic pathways and biological roles for receptor-independent activators of G-protein signaling. Pharmacol. Ther. 113, 488–506 - PMC - PubMed
    1. De Vries L., Fischer T., Tronchère H., Brothers G. M., Strockbine B., Siderovski D. P., Farquhar M. G. (2000) Activator of G-protein signaling 3 is a guanine dissociation inhibitor for Gαi subunits. Proc. Natl. Acad. Sci. U.S.A. 97, 14364–14369 - PMC - PubMed
    1. Du Q., Stukenberg P. T., Macara I. G. (2001) A mammalian Partner of inscuteable binds NuMA and regulates mitotic spindle organization. Nat. Cell Biol. 3, 1069–1075 - PubMed

Publication types

MeSH terms