. 2013 Jan 25;288(4):2388-402.
doi: 10.1074/jbc.M112.403832. Epub 2012 Dec 4.

ISG15 deregulates autophagy in genotoxin-treated ataxia telangiectasia cells

Affiliations

ISG15 deregulates autophagy in genotoxin-treated ataxia telangiectasia cells

Shyamal D Desai et al. J Biol Chem. .

Abstract

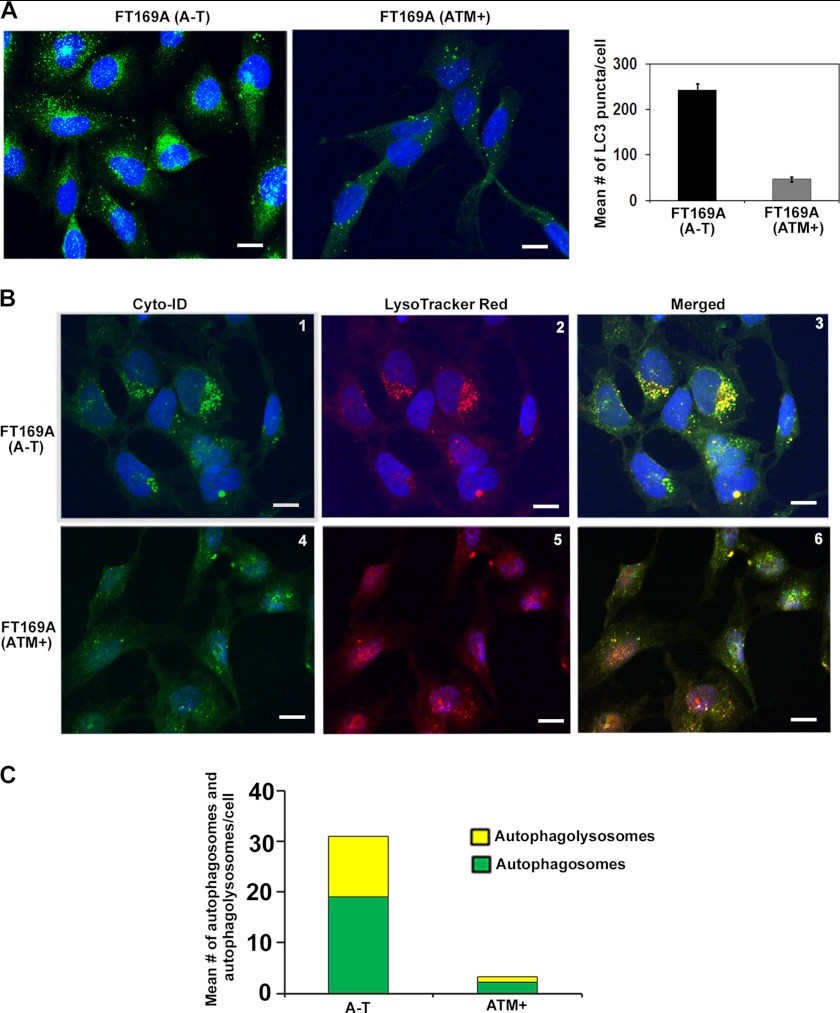
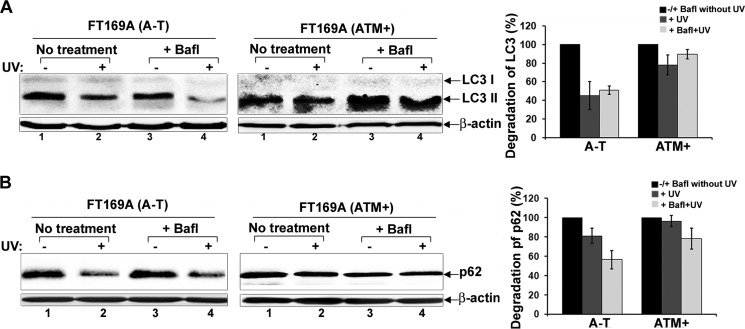
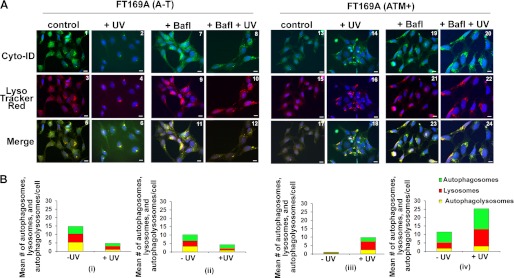
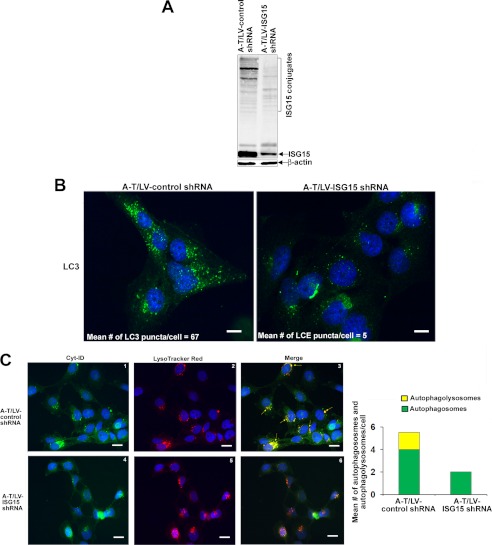
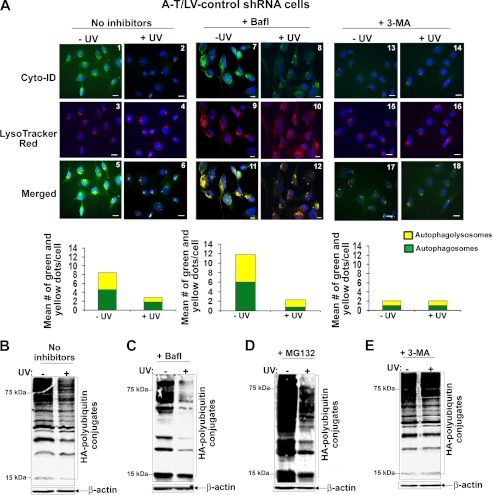
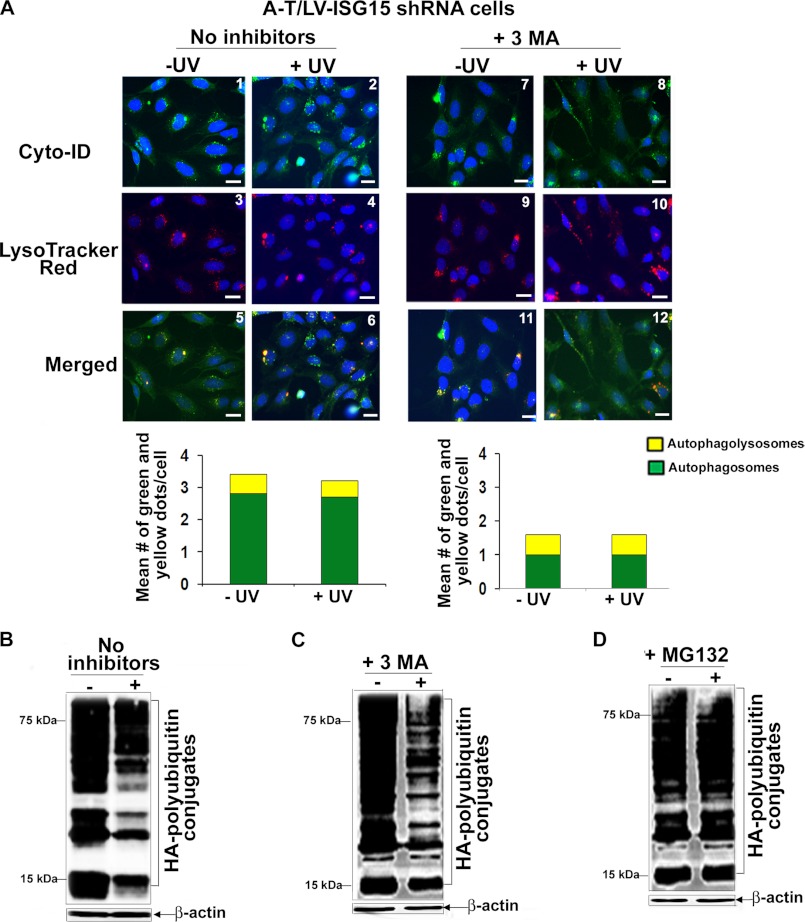
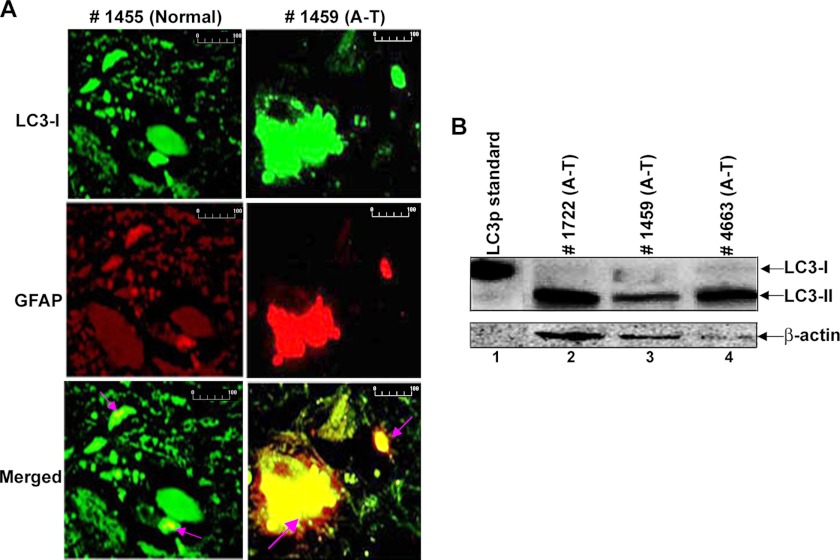
Ataxia-telangiectasia (A-T) is a cerebellar neurodegenerative disorder; however, the basis for the neurodegeneration in A-T is not well established. Lesions in the ubiquitin and autophagy pathways are speculated to contribute to the neurodegeneration in other neurological diseases and may have a role in A-T neurodegeneration. Our recent studies revealed that the constitutively elevated ISG15 pathway impairs targeted proteasome-mediated protein degradation in A-T cells. Here, we demonstrate that the basal autophagy pathway is activated in the ubiquitin pathway-compromised A-T cells. We also show that genotoxic stress triggers aberrant degradation of the proteasome and autophagy substrates (autophagic flux) in A-T cells. Inhibition of autophagy at an early stage using 3-methyladenine blocked UV-induced autophagic flux in A-T cells. On the other hand, bafilomycin A1, which inhibits autophagy at a late stage, failed to block UV-induced autophagic flux, suggesting that overinduction of autophagy may underlie aberrant autophagic flux in A-T cells. The ISG15-specific shRNA that restored proteasome function restores autophagic function in A-T cells. These findings suggest that autophagy compensates for the ISG15-dependent ablation of proteasome-mediated protein degradation in A-T cells. Genotoxic stress overactivates this compensatory mechanism, triggering aberrant autophagic flux in A-T cells. Supporting the model, we show that autophagy is activated in the brain tissues of human A-T patients. This highlights a plausible causal contribution of a novel "ISG15 proteinopathy" in A-T neuronal cell death.


Figures

FIGURE 1.
FIGURE 1.
Genotoxic stress induces aberrant degradation of the polyubiquitylated proteins in A-T cells. A, A-T and ATM+ cells were exposed to different doses of UV and allowed to recover for 3 h. Cells were lysed, and lysates were analyzed by Western blotting for polyubiquitylated proteins and tubulin using anti-ubiquitin and anti-tubulin antibodies, respectively. B, A-T and ATM+ cells were transfected with a HA-ubiquitin construct. Cells were then treated with MG132 (1 μm) or Bafl (1 nm) for 18 h and exposed to UV radiation (25 mJ/m2). After recovery in the presence of inhibitors for an additional 3 h, cells were lysed. Cell extracts were analyzed by Western blotting for HA-polyubiquitylated proteins and actin using anti-HA and anti-actin antibodies, respectively. Intensity of the total HA-polyubiquitylated proteins was quantitated using Bio-Rad Quantity One software. The bar graph shows average values ± S.E. (error bars) of percentage degradation of HA-polyubiquitylated proteins from three independent experiments. C, A-T and ATM+ cells were transfected with a HA-Lys48-only ubiquitin construct. The inhibitor and UV treatments, cell lysis, SDS-PAGE, and immunoblotting analysis to detect HA-ubiquitin-conjugated proteins using anti-HA antibodies was carried out as described in B. The experiment was repeated two times with reproducible results. D, A-T cells were treated with camptothecin (10 μm) in the presence or absence of Bafl (1 nm) for 24 h. Ubiquitin-conjugated proteins using anti-ubiquitin antibodies were detected as described in A. The experiment was repeated three times, and the two-tailed p values are presented under “Results.”
FIGURE 2.
FIGURE 2.
Basal autophagy is activated in A-T cells. A, representative immunofluorescence images of LC3 puncta in A-T and ATM+ cells are shown (left) (scale bar, 10 μm); the average number ± S.E. (error bars) of puncta counted in 50 cells in different fields is shown in the bar graph (right). B, representative images of A-T (panels 1–3) and ATM+ (panels 4–6) cells co-stained with Cyt-ID® and LysoTracker Red® dyes are shown (scale bar, 10 μm). C, green (autophagosomes; from Cyt-ID®-stained panels) and yellow (autophagolysosomes; from merged panels) dots in cells were counted manually using the ImageJ plug-in cell counter. The average number of dots/cell is shown in the bar graph. Experiments were repeated two times with similar results.
FIGURE 3.
FIGURE 3.
Genotoxic stress induces aberrant autophagic flux in A-T cells; Western blot analysis. A and B, A-T and ATM+ cells were treated with Bafl (1 nm for 18 h) and then exposed to UV as indicated (25 mJ/m2). 3 h after recovery in the presence of inhibitors, cells were lysed. Cell lysates were analyzed by Western blotting for LC3 (A), p62 (B), and actin (bottom panels in A and B) using their specific antibodies. Intensity of the total LC3 (LC3-I + II) and p62 proteins was quantitated using Bio-Rad Quantity One software. The bar graphs in A and B show average values ± S.E. (error bars) of percentage degradation of LC3 and p62 from three independent experiments. All control values (−UV and +Bafl) are normalized to 100%, and values for experimental treatments are expressed as percentage variations over control.
FIGURE 4.
FIGURE 4.
Genotoxic stress induces aberrant autophagic flux in A-T cells; immunofluorescence analysis. A, A-T (panels 1–12) and ATM+ (panels 13–24) cells were treated with Bafl (1 nm for 18 h) and then exposed to UV (25 mJ/m2) as indicated. 3 h after recovery in the presence of inhibitors, cells were co-stained with Cyt-ID® and LysoTracker Red® dyes. Representative fluorescence images of Cyt-ID®- and LysoTracker Red®-stained cells are shown (scale bar, 10 μm). B, green (autophagosomes; from Cyt-ID®-stained panels), red (lysosomes; from LysoTracker Red-stained panels), and yellow (autophagolysosomes; from merged panels) dots in A-T (left panel) and ATM+ (right panel) cells were counted manually using the ImageJ plug-in Cell Counter. The mean number of dots/cell is shown in the bar graphs. Experiments were repeated two times with similar results.
FIGURE 5.
FIGURE 5.
Autophagy activation is a consequence of the elevated expression of the ISG15 pathway in A-T cells. A, extracts of A-T/LV-control and ISG15 shRNA cells were analyzed by Western blotting for ISG15 and actin. B, representative immunofluorescence images of LC3 puncta in A-T/control (left) and ISG15 (right) shRNA cells are shown (scale bar, 10 μm). C, representative images of A-T/control (panels 1–3) and ISG15 (panels 4–6) shRNA cells co-stained with Cyt-ID® and LysoTracker Red® (red; for lysosomes) dyes are shown. Yellow color in the merged images indicates autophagolysosomes. Scale bar, 10 μm. The mean number of green (autophagosomes) and yellow (autophagolysosomes) dots/cell counted manually using the ImageJ plug-in Cell Counter is shown in the bar graphs. Experiments were repeated two times with similar results.
FIGURE 6.
FIGURE 6.
UV-induced autophagic flux is attenuated in ISG15-silenced A-T cells; Western blot analysis. A and B, A-T/LV-control and ISG15 shRNA cells were treated with Bafl (1 nm for 18 h) or left untreated. Cells were then exposed to UV (25 mJ/m2). 3 h after recovery in the presence of inhibitors, cells were lysed, and lysates were analyzed by Western blotting for LC3 (A), p62 (B), and actin (bottom panels of A and B) using their specific antibodies. Intensity of the total LC3 (LC3-I + II) and p62 proteins was quantitated using Bio-Rad Quantity One software. The bar graphs in A and B show average values ± S.E. (error bars) of percentage degradation of LC3 and p62 from three independent experiments. All control values (−UV and +Bafl) are normalized to 100%, and values for experimental treatments were expressed as percentage variations over control.
FIGURE 7.
FIGURE 7.
Inhibition of autophagy at an early stage using 3-MA blocks UV-induced aberrant autophagic flux in A-T cells. A, A-T/LV-control shRNA cells were either left untreated (panels 1, 3, and 5) or treated with Bafl (1 nm for 18 h) (panels 7, 9, and 11) or treated with 3-MA (10 nm for 18 h) (panels 13, 15, and 17). Cells were then exposed to UV (25 mJ/m2) (panels 2, 4, 6, 8, 10, 12, 14, 16, and 18). 3 h after recovery in the presence of the respective inhibitors, cells were co-stained with Cyt-ID® and LysoTracker Red® dyes. Representative fluorescence images of Cyt-ID®- and LysoTracker Red®-stained cells are shown. The mean number of green (autophagosomes) and yellow (autophagolysosomes) dots/cell counted manually using the ImageJ plug-in Cell Counter is shown in the bar graphs. Experiments were performed twice and yielded similar results (scale bar, 10 μm). B, HA-ubiquitin-transfected A-T/LV-control shRNA cells were exposed to UV (25 mJ/m2). After 3 h of recovery, assessment of HA-polyubiquitylated proteins was carried out as described in the legend to Fig. 1B. C, HA-ubiquitin-transfected A-T/LV-control shRNA cells were treated with Bafl (1 nm for 18 h). Cells were then exposed to UV (25 mJ/m2). After 3 h of recovery in the presence of the inhibitor, assessment of HA-polyubiquitylated proteins was carried out as described in B. D, HA-ubiquitin-transfected A-T/LV-control shRNA cells were treated with MG132 (1 nm for 18 h). Cells were then exposed to UV (25 mJ/m2). After 3 h of recovery in the presence of the inhibitor, assessment of HA-polyubiquitylated proteins was carried out as described in B. E, HA-ubiquitin-transfected A-T/LV-control shRNA cells were treated with 3-MA (10 nm for 18 h). Cells were then exposed to UV (25 mJ/m2). After 3 h of recovery in the presence of the inhibitor, assessment of HA-polyubiquitylated proteins was carried out as described in B. All experiments shown in B–E were performed at least three times and yielded similar results.
FIGURE 8.
FIGURE 8.
In the absence of the functional autophagy pathway, ubiquitylated proteins are degraded via proteasome in UV-treated ISG15-silenced A-T cells. A, A-T/LV-ISG15 shRNA cells were either left untreated (panels 1, 3, and 5) or treated with 3-MA (10 nm for 18 h) (panels 7, 9, and 11). Cells were then exposed to UV (25 mJ/m2) (panels 2, 4, 6, 8, 10, and 12). 3 h after recovery in the presence of the inhibitor, cells were co-stained with Cyt-ID® and LysoTracker Red® dyes. Representative fluorescence images of Cyt-ID®- and LysoTracker Red®-stained cells are shown. The mean number of green (autophagosomes) and yellow (autophagolysosomes) dots/cell counted manually using the ImageJ plug-in Cell Counter is shown in the bar graphs. Experiments was performed twice and yielded similar results (scale bar, 10 μm). B, HA-ubiquitin-transfected A-T/LV-ISG15 shRNA cells were exposed to UV (25 mJ/m2). After 3 h of recovery, assessment of HA-polyubiquitylated proteins was carried out as described in the legend to Fig. 1B. C, HA-ubiquitin-transfected A-T/LV-ISG15 shRNA cells were treated with 3-MA (10 nm for 18 h). Cells were then exposed to UV (25 mJ/m2). After 3 h of recovery in the presence of the inhibitor, assessment of HA-polyubiquitylated proteins was carried out as described in B. D, HA-ubiquitin-transfected A-T/LV-control shRNA cells were treated with MG132 (1 nm for 18 h). Cells were then exposed to UV (25 mJ/m2). After 3 h of recovery in the presence of inhibitor, assessment of HA-polyubiquitylated proteins was carried out as described in B. All experiments shown in B–D were performed at least three times and yielded similar results.
FIGURE 9.
FIGURE 9.
Evidence for the activation of autophagy in human brains of A-T patients. A, the deparaffinized human brain tissue sections from the normal subject and A-T patient were double-stained with anti-LC3- and anti-GFAP-specific antibodies (scale bar, 100 μm). B, frozen mid-brain post-mortem tissue lysates were analyzed by Western blotting using anti-LC3 antibodies. The positive control for anti-LC3 protein (HA-tagged) (MBL International) was loaded in lane 1.

Similar articles

Cited by

References

    1. Frappart P. O., McKinnon P. J. (2006) Ataxia-telangiectasia and related diseases. Neuromolecular Med. 8, 495–511 - PubMed
    1. Lavin M. F., Khanna K. K. (1999) ATM. The protein encoded by the gene mutated in the radiosensitive syndrome ataxia-telangiectasia. Int. J. Radiat. Biol. 75, 1201–1214 - PubMed
    1. Boder E. (1985) Ataxia-telangiectasia. An overview. Kroc Found. Ser. 19, 1–63 - PubMed
    1. Chun H. H., Gatti R. A. (2004) Ataxia-telangiectasia, an evolving phenotype. DNA Repair 3, 1187–1196 - PubMed
    1. Easton D. F. (1994) Cancer risks in A-T heterozygotes. Int. J. Radiat. Biol. 66, S177–S182 - PubMed

Publication types

MeSH terms