. 2013 Jan 25;288(4):2261-70.
doi: 10.1074/jbc.M112.411033. Epub 2012 Dec 3.

Chemical genetic screen reveals a role for desmosomal adhesion in mammary branching morphogenesis

Affiliations

Chemical genetic screen reveals a role for desmosomal adhesion in mammary branching morphogenesis

Kaitlin J Basham et al. J Biol Chem. .

Abstract

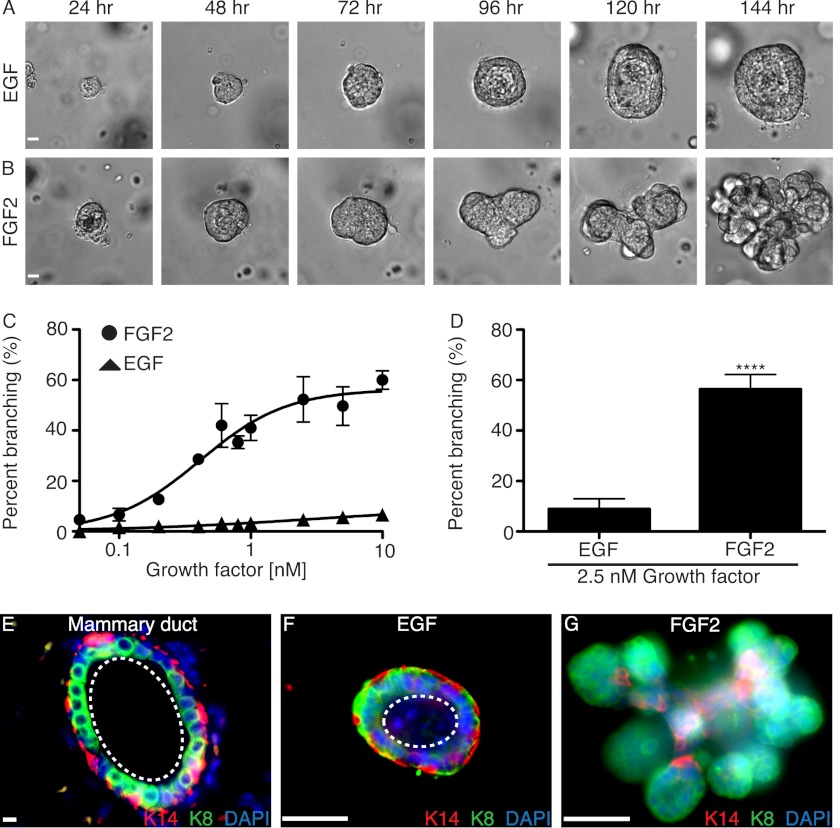
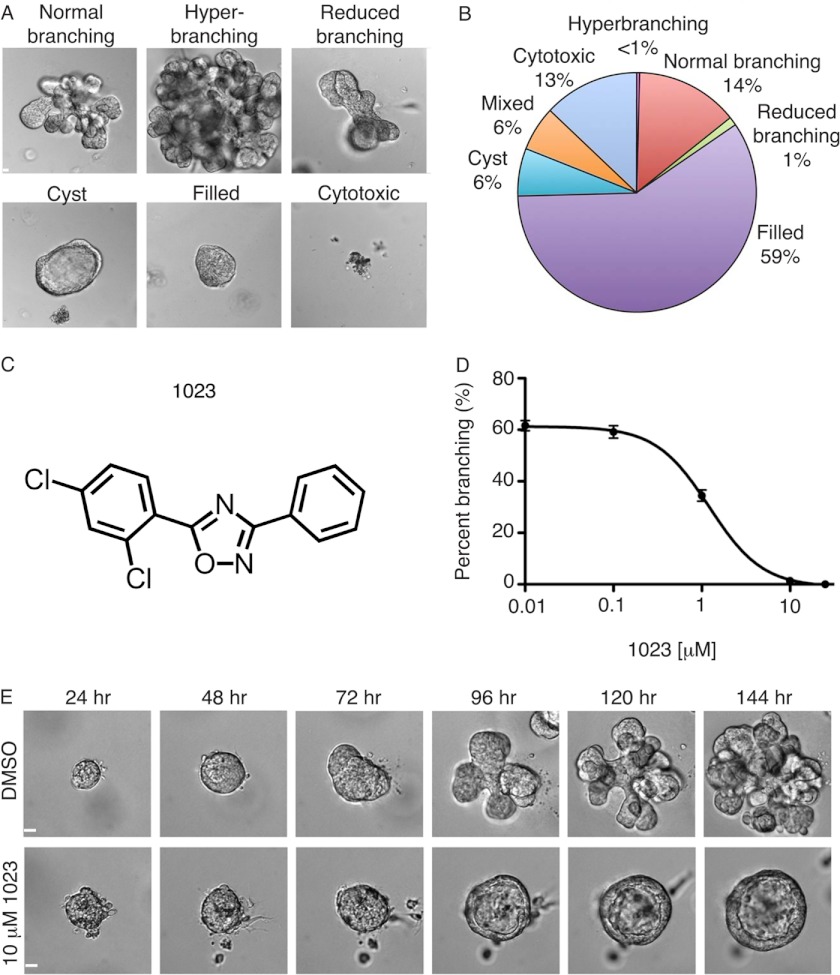
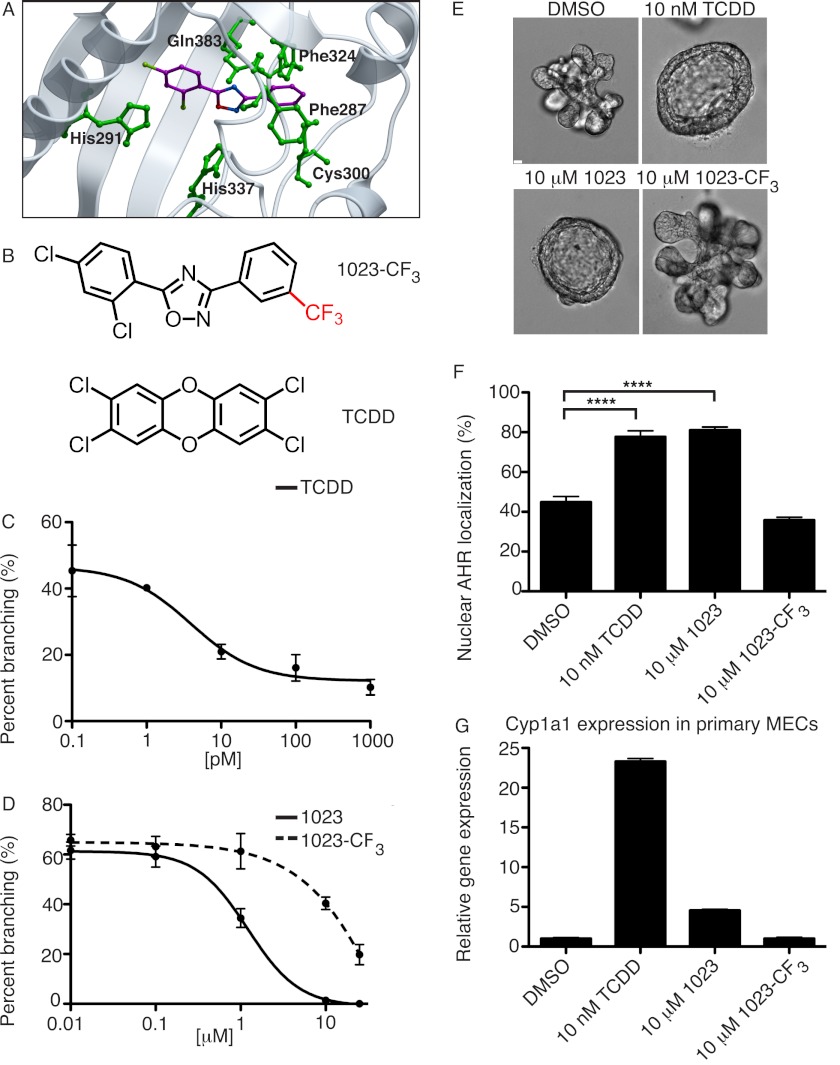
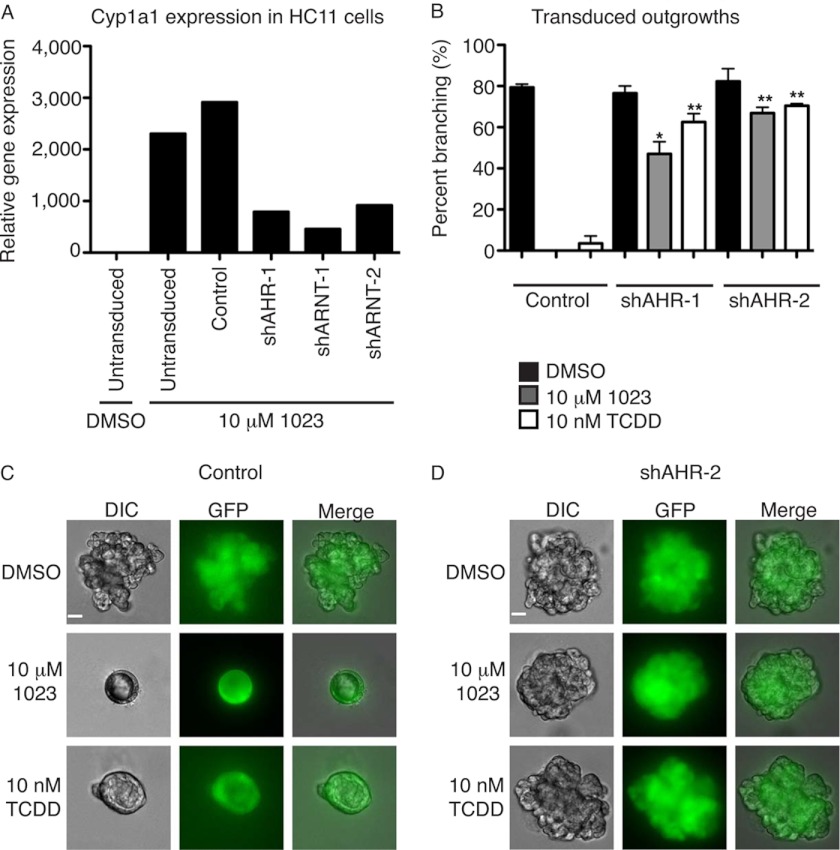
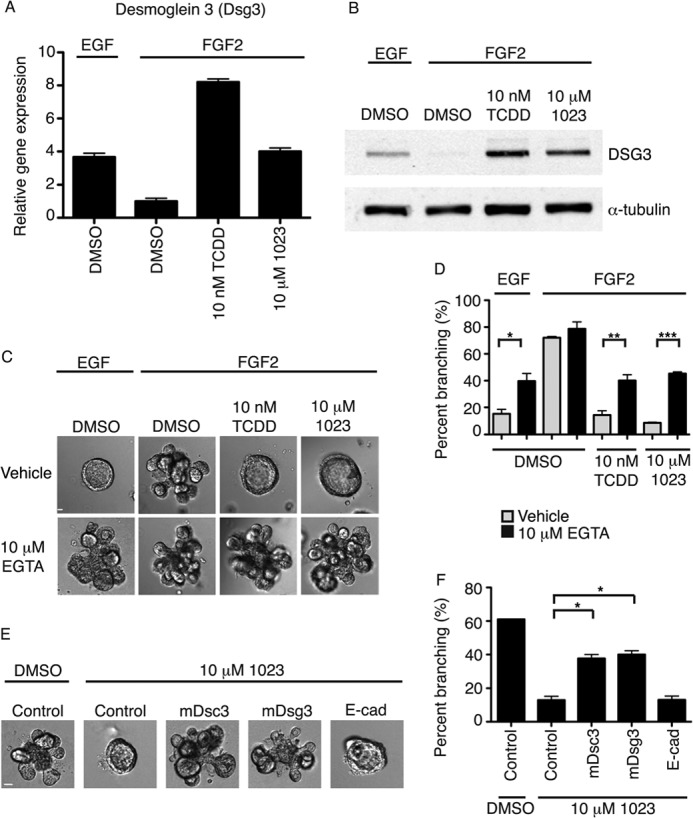
During the process of branching morphogenesis, the mammary gland undergoes distinct phases of remodeling to form an elaborate ductal network that ultimately produces and delivers milk to newborn animals. These developmental events rely on tight regulation of critical cellular pathways, many of which are probably disrupted during initiation and progression of breast cancer. Transgenic mouse and in vitro organoid models previously identified growth factor signaling as a key regulator of mammary branching, but the functional downstream targets of these pathways remain unclear. Here, we used purified primary mammary epithelial cells stimulated with fibroblast growth factor-2 (FGF2) to model mammary branching morphogenesis in vitro. We employed a forward chemical genetic approach to identify modulators of this process and describe a potent compound, 1023, that blocks FGF2-induced branching. In primary mammary epithelial cells, we used lentivirus-mediated knockdown of the aryl hydrocarbon receptor (AHR) to demonstrate that 1023 acts through AHR to block branching. Using 1023 as a tool, we identified desmosomal adhesion as a novel target of AHR signaling and show that desmosomes are critical for AHR agonists to block branching. Our findings support a functional role for desmosomes during mammary morphogenesis and also in blocking FGF-induced invasion.


Figures

FIGURE 1.
FIGURE 1.
Primary MECs branch in the presence of FGF2. A, aggregated primary MECs grown in Matrigel with 2.5 nm EGF underwent extensive reorganization to form a fluid-filled cyst between 72 and 96 h in culture. Continued growth was observed through 144 h. B, 2.5 nm FGF2 stimulated robust branching. Aggregates initially reorganized to form a cyst, which collapsed near 72 h in culture. Extensive branching and increased growth was observed through 144 h in culture. Representative time course DIC images are shown. C, dose-response analysis for EGF- and FGF2-induced branching over 144 h. D, quantification of percentage of branching in primary MECs grown for 144 h with 2.5 nm EGF or 2.5 nm FGF2. Statistical analysis was performed using Student's t test. Results are shown as mean ± S.D. (error bars); n = 3; ****, p < 0.0001. E, mammary ducts are composed of an epithelial bilayer, as shown by immunofluorescence staining of a cross-section of a duct from a virgin FVB/n mouse with a luminal epithelial marker, K8 (green), and a myoepithelial marker, K14 (red). F, immunofluorescence staining for K8 and K14 in our three-dimensional primary MEC culture model with 2.5 nm EGF. G, immunofluorescence staining for K8 and K14 in our three-dimensional primary MEC culture model with 2.5 nm FGF2. E–G, interactions between luminal epithelial and myoepithelial cells were similar to those observed in vivo. Nuclei were stained with DAPI (in blue). The dashed white line defines the lumen. A, B, and E–G, scale bar, 40 μm.
FIGURE 2.
FIGURE 2.
Chemical library screen identifies 1023 as a potent inhibitor of in vitro branching morphogenesis. A, six dominant phenotypes were observed in a chemical library screen for alterations on FGF2-induced branching. Representative DIC images of the phenotypes observed are shown. B, quantification of the percentage of total compounds that induced each phenotype. C, structure of 1023, which was one of the most potent compounds to cause cyst arrest. D, dose-response analysis for FGF2-induced branching in the presence of 1023 over 144 h. E, representative time course DIC images of MECs grown in the FGF2 branching assay with DMSO (vehicle control) (top) or 10 μm 1023 (bottom). A and E, scale bar, 40 μm. Error bars, S.D.
FIGURE 3.
FIGURE 3.
1023 activates the aryl hydrocarbon receptor. A, docking of 1023 (purple) with the homology model structure of human AHR (gray). Important interacting residues are noted in green. The binding free energy was estimated at −20.83 kcal/mol, suggesting a favorable interaction between 1023 and AHR. B, chemical structures of 1023-CF3 (top), a predicted inactive analog of 1023, and TCDD (bottom), a known activator of AHR. C, dose-response analysis for FGF2-induced branching in primary MECs treated with TCDD for 144 h. D, 1023-CF3 was less effective at blocking branching than 1023, as shown by dose-response analysis over 144 h for FGF2-induced branching. Error bars S.D. E, representative DIC images of the dominant phenotype observed in primary MECs grown in the FGF2 branching assay with DMSO (top left), 10 nm TCDD (top right), 10 μm 1023 (bottom left), or 10 μm 1023-CF3 (bottom right). Scale bar, 40 μm. F, in HEK-293T cells transiently expressing pACTAG2-HA-AHR, 10 nm TCDD and 10 μm 1023 increased nuclear localization of AHR compared with DMSO or 10 μm 1023-CF3 after 24 h of treatment. Quantification was based on immunofluorescence for HA. Results are shown as mean ± S.D.; n = 7; ****, p < 0.0001. G, relative gene expression of Cyp1a1, a known AHR response gene, was elevated in primary MECs treated for 48 h with 10 nm TCDD or 10 μm 1023 compared with DMSO or 10 μm 1023-CF3. Cyp1a1 gene expression was measured by RT-PCR and normalized to β-actin expression. Results are shown as mean ± S.E. (error bars); n = 3; ***, p < 0.001; **, p < 0.01. F and G, statistical analysis was performed using Student's t test.
FIGURE 4.
FIGURE 4.
AHR is the biological target of 1023. A, induction of Cyp1a1 by 1023 was lower in HC11 cells stably expressing an shRNA against Ahr (shAHR-1) or Arnt (shARNT-1 or shARNT-2) than untransduced or control transduced cells. Cyp1a1 gene expression was measured after 6 days of treatment with DMSO or 10 μm 1023 and normalized to β-actin expression. Results are shown as mean ± S.E. (error bars). B, knockdown of Ahr in primary MECs rescued branching in the presence of AHR agonists. Shown is a quantification of the percentage of branching in transduced outgrowths from primary MECs infected with a lentiviral control shRNA (Control) or shRNA against Ahr (shAHR-1 or shAHR-2). Statistical analysis was performed using Student's t test. Results are shown as mean ± S.D. (error bars); n = 2; *, p < 0.05; **, p < 0.01. C, representative images of a clonal outgrowth from primary MECs transduced with a control shRNA. D, representative images of a clonal outgrowth from primary MECs transduced with shAHR-2. B–D, following transduction, cells were embedded in Matrigel as single cells and grown for 21 days in the presence of 2.5 nm FGF2 and DMSO, 10 nm TCDD, or 10 μm 1023. C and D, scale bar, 40 μm.
FIGURE 5.
FIGURE 5.
AHR signaling promotes desmosomal adhesion to block mammary branching morphogenesis. A, relative gene expression of Dsg3 (desmoglein 3) in aggregated primary MECs grown for 96 h in Matrigel with 2.5 nm EGF or 2.5 nm FGF2 and DMSO or 10 nm TCDD or 10 μm 1023. Gene expression was measured by RT-PCR and normalized to β-actin expression. Results are shown as mean ± S.E. (error bars). B, Western blot analysis of DSG3 in aggregated primary MECs grown for 96 h in Matrigel with 2.5 nm EGF or 2.5 nm FGF2 and DMSO or 10 nm TCDD or 10 μm 1023. C, the addition of 10 μm EGTA significantly increased branching of primary MECs grown in the presence of 2.5 nm EGF or in the presence of 2.5 nm FGF2 and 10 nm TCDD or 10 μm 1023 compared with vehicle control. Representative DIC images are shown. D, quantification of branching shown as mean ± S.D. (error bars); n = 3; *, p < 0.05; **, p < 0.01; ***, p < 0.001. C and D, EGTA was added after 48 h in culture, and branching was scored at 144 h. E, the addition of 2 mm blocking peptide against DSC3 or DSG3, but not E-cadherin or a nonspecific control peptide, significantly increased branching of primary MECs grown in the presence of FGF2 and 10 μm 1023. Representative DIC images are shown. F, quantification of branching shown as mean ± S.D. (error bars); n = 3; *, p < 0.05. E and F, peptide was added after 48 h in culture, and branching was scored at 144 h. C and E, scale bar, 40 μm. D and F, statistical analysis was performed using Student's t test.

Similar articles

Cited by

References

    1. Lu P., Werb Z. (2008) Patterning mechanisms of branched organs. Science 322, 1506–1509 - PMC - PubMed
    1. Lu P., Sternlicht M. D., Werb Z. (2006) Comparative mechanisms of branching morphogenesis in diverse systems. J. Mammary Gland Biol. Neoplasia 11, 213–228 - PMC - PubMed
    1. Smith B. A., Welm A. L., Welm B. E. (2012) On the shoulders of giants: A historical perspective of unique experimental methods in mammary gland research. Semin. Cell Dev. Biol. 23, 583–590 - PMC - PubMed
    1. Sternlicht M. D. (2006) Key stages in mammary gland development. The cues that regulate ductal branching morphogenesis. Breast Cancer Res. 8, 201. - PMC - PubMed
    1. Sternlicht M. D., Kouros-Mehr H., Lu P., Werb Z. (2006) Hormonal and local control of mammary branching morphogenesis. Differentiation 74, 365–381 - PMC - PubMed

Publication types

MeSH terms