. 2013 Feb 1;19(3):560-70.
doi: 10.1158/1078-0432.CCR-12-2334. Epub 2012 Dec 4.

SLC1A5 mediates glutamine transport required for lung cancer cell growth and survival

Affiliations

SLC1A5 mediates glutamine transport required for lung cancer cell growth and survival

Mohamed Hassanein et al. Clin Cancer Res. .

Abstract

Purpose: We have previously identified solute-linked carrier family A1 member 5 (SLC1A5) as an overexpressed protein in a shotgun proteomic analysis of stage I non-small cell lung cancer (NSCLC) when compared with matched controls. We hypothesized that overexpression of SLC1A5 occurs to meet the metabolic demand for lung cancer cell growth and survival.

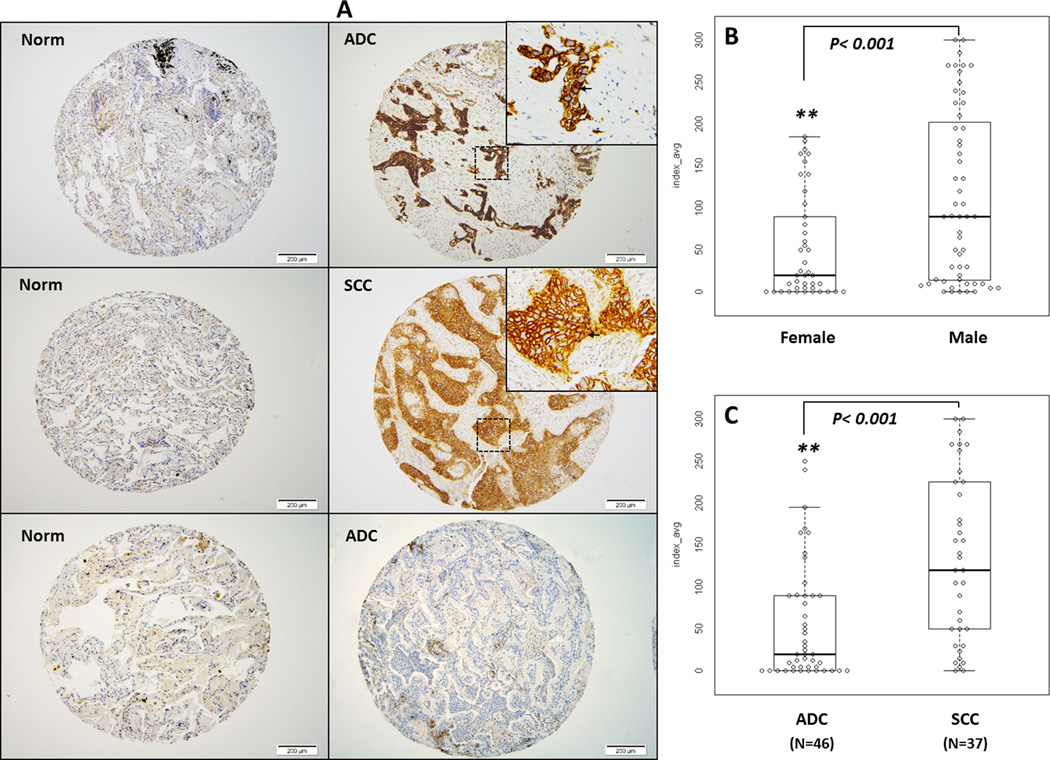
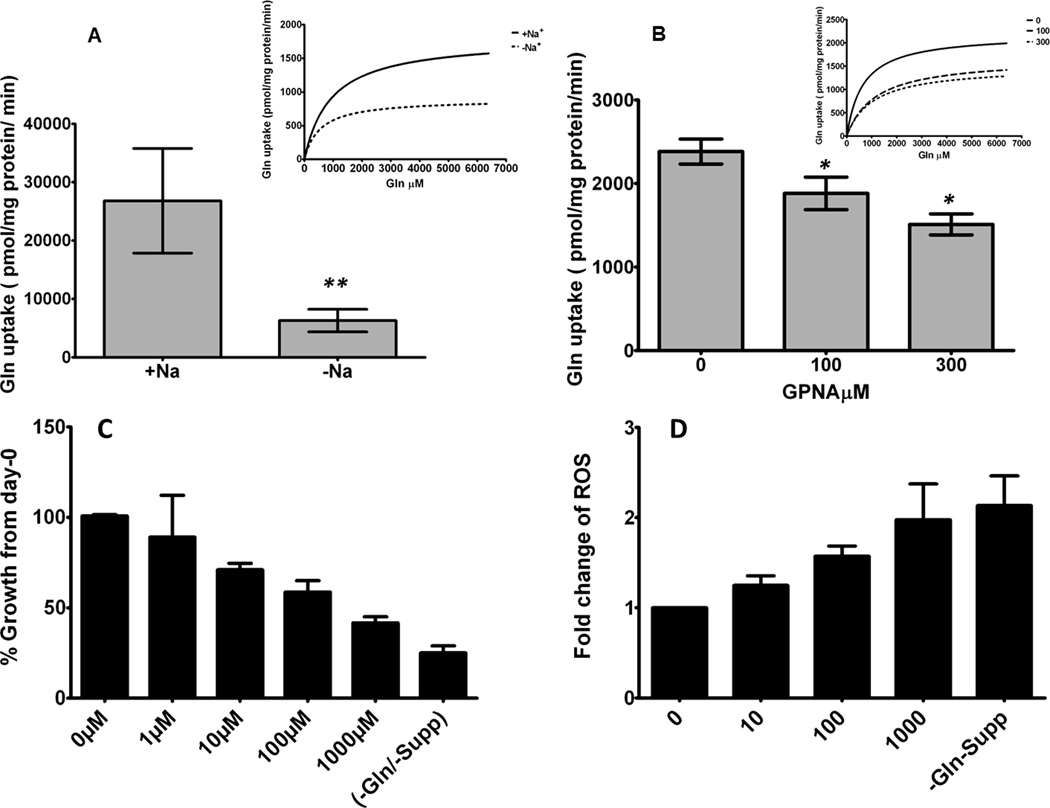
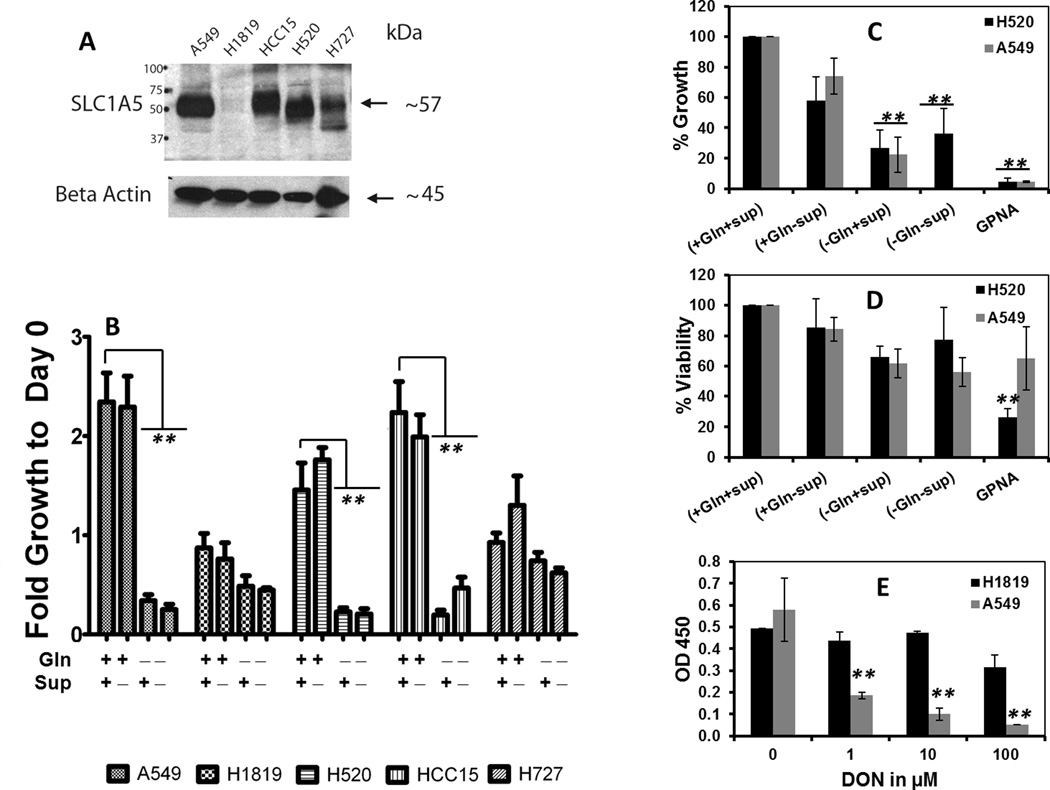
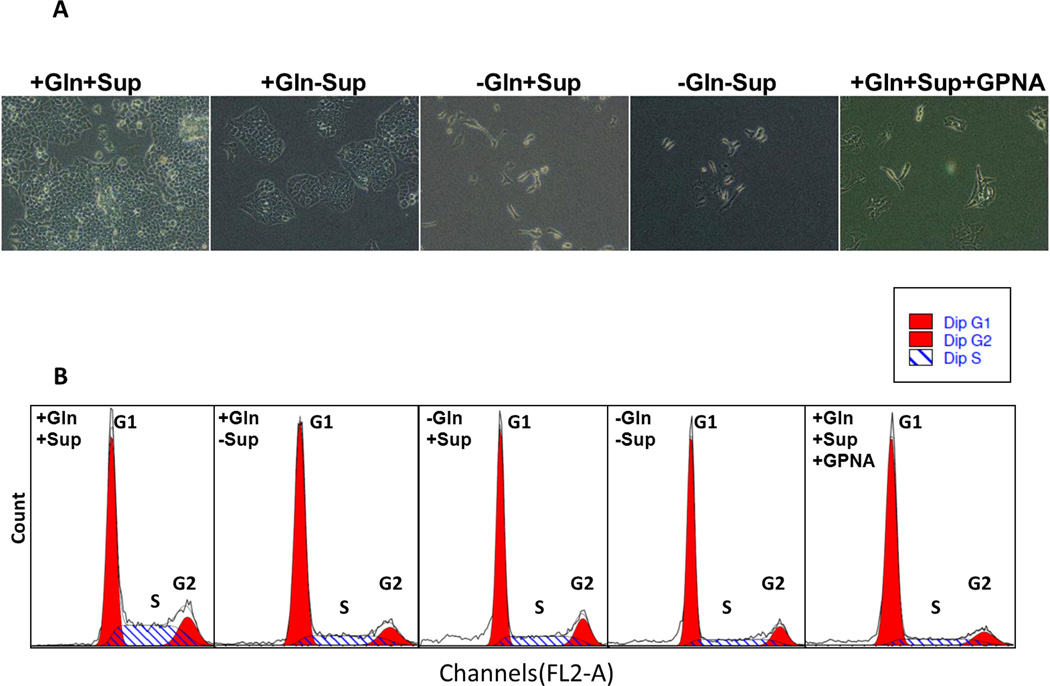
Experimental design: To test our hypothesis, we first analyzed the protein expression of SLC1A5 in archival lung cancer tissues by immunohistochemistry and immunoblotting (N = 98) and in cell lines (N = 36). To examine SLC1A5 involvement in amino acid transportation, we conducted kinetic analysis of l-glutamine (Gln) uptake in lung cancer cell lines in the presence and absence of a pharmacologic inhibitor of SLC1A5, gamma-l-Glutamyl-p-Nitroanilide (GPNA). Finally, we examined the effect of Gln deprivation and uptake inhibition on cell growth, cell-cycle progression, and growth signaling pathways of five lung cancer cell lines.

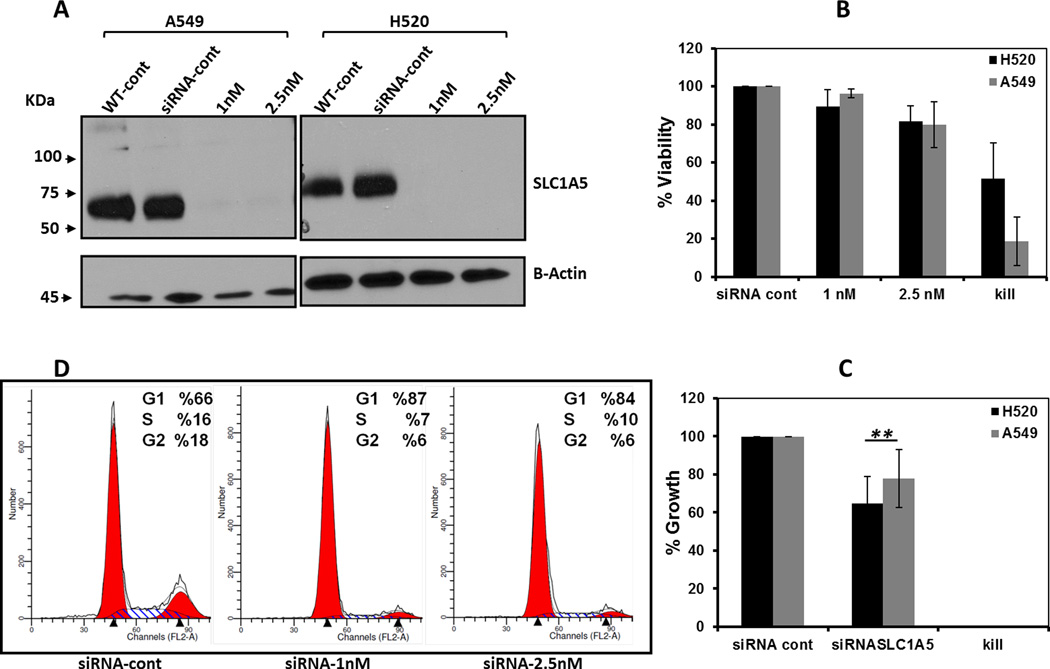
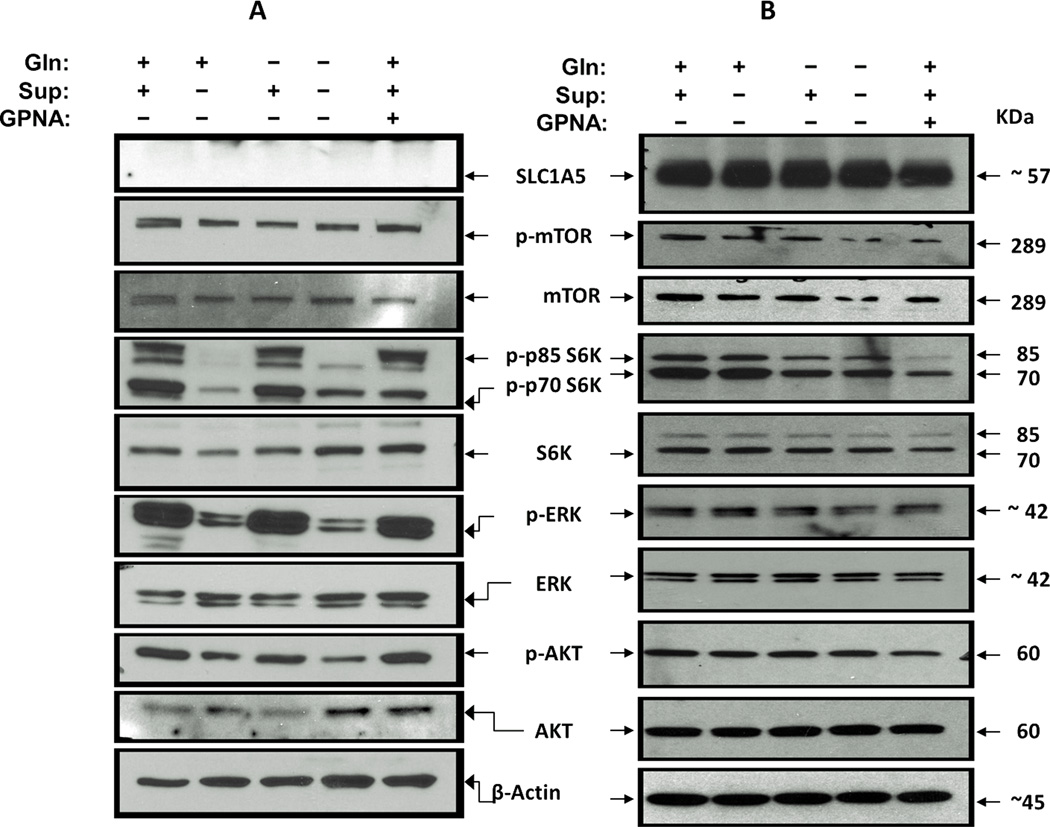
Results: Our results show that (i) SLC1A5 protein is expressed in 95% of squamous cell carcinomas (SCC), 74% of adenocarcinomas (ADC), and 50% of neuroendocrine tumors; (ii) SLC1A5 is located at the cytoplasmic membrane and is significantly associated with SCC histology and male gender; (iii) 68% of Gln is transported in a Na(+)-dependent manner, 50% of which is attributed to SLC1A5 activity; and (iv) pharmacologic and genetic targeting of SLC1A5 decreased cell growth and viability in lung cancer cells, an effect mediated in part by mTOR signaling.

Conclusions: These results suggest that SLC1A5 plays a key role in Gln transport controlling lung cancer cells' metabolism, growth, and survival.


Conflict of interest statement

CONFLICT OF INTEREST

No potential conflicts of interest were disclosed.

Figures

Figure 1
Figure 1. SLC1A5 is differentially expressed in NSCLC tumors and located at the level of the cytoplasmic membrane
(A) Representative images of IHC staining for SLC1A5 protein in a tissue microarray (TMA) constructed from archival lung tissue sections collected from 98 lung cancer patients representing the main lung cancer histologic subtypes. The left panel consists of 3 representative photomicrographs at 100× magnification of sections of normal lung tissue from patients with lung cancer which stained negative for SLC1A5. The right panel consists of representative photomicrographs at 100× magnification of lung cancer sections from patients with stage IIA ADC and IIB SCC. A zoomed in 200× magnification of a small area of the same sections in the upper right corner shows membranous staining pattern of cancer cells. A section of ADC that did not stain for SLC1A5 is also represented here. (B) A box plot of SLCA15 protein IHC index (intensity × % tumor cells) shows significantly higher index of staining (p<0.001) of tumors in males (N=56) than in females (N=42). (C) A box plot of SLCA15 protein IHC index shows significantly increased IHC staining index in SCC compared to ADC (p<0.001). A detailed summary of our IHC analysis is provided in table 1.
Figure 2
Figure 2. Gln uptake is Na+-dependent and mediated partially by SLC1A5
To examine if intracellular transportation of Gln, human ADC A549 cells were seeded at the indicated cell densities into 24-well culture plates (0.5 mL/well). (A) The Na+-dependent uptake of 1.6mM of L-glutamine was monitored for 3 minute at 37 C. Each point represents the average ± SEM for quadruplicate determinations. This figure also illustrates the Michaelis–Menten kinetics of glutamine rates in cholKRP (-Na+) or NaKRP (+Na+) (A, upper right), (+Na+) > (−Na+). (**p < 0.005 [n = 3]). (B) Vmax values of Gln uptake kinetics of A549 cells in the presence of 0, 100 and 300 µM GPNA and the upper right panel shows the Michaelis–Menten kinetics of glutamine rates. (C) dose-response inhibition of % growth of A549 after incubation in full growth media (+Gln+supp) containing increasing doses of GPNA. (D) The intracellular ROS levels in A549 cells were measured by measuring the florescence signal of H2 DCFDA (Ex488nm/ Emiss525nm) using microtiter plate reader after 24 h incubation in increasing doses of GPNA. These data are representative of at least three independent observations and results are average ± SEM.
Figure 3
Figure 3. Glutamine is required for growth of lung cancer cells in vitro
To test whether SLC1A5 expression is correlated with Gln-dependent growth of lung cancer cells in vitro, 5 lung cancer cell lines that vary in their expression level of SLC1A5 protein (A) were grown in culture media that are supplemented with EGF, Insulin, selenium and transferein and 2mM of L-glutamine (+Gln+Sup), or L-glutamine but no supplements (+Gln-Sup), or no L-glutamine but with supplements (−Gln+Supp) or not supplemented with neither L-glutamine not supplements. (B) The fold change in cell growth was analyzed at day 3 by Cell-Titer 96-Aqueous Colorimetric Assay as a change of OD at 490nm signal from day 0. Sensitivity of growth inhibition to Gln deprivation was significant in cell lines that overexpress SLC1A5, A549, H520 and HCC15 but not in cell lines that have low or undetectable level of the protein H1819 and H727. (C) The effect of Gln deprivation on cell viability in SLC1A5 expressing cell lines A549 and H520 were measured by Trypan blue Exclusion Dye method after 48 h of culturing in media that either supplemented or deprived of Gln. (D) The anti-growth effect of Gln deprivation was measure by calculating the net increase or decrease of cellular growth after 48 hour of culturing under media that either supplemented or deprived of Gln or fully supplemented media + 1mM of GPNA using the following equation (Ti−Tz)/(C−Tz)×100. Where Ti is the cell number after 48 hours of treatment of growth stimuli or inhibitors (i=inhibition), Tz is the cell number at time zero and C is the cell number of the control cells that were cultured in optimum growth conditions (+Gln +Sup). (E) Dose response decline in cell growth after treatment of A549 and H1819 with increasing concentrations of DON for 48 hours. Statistical significance was assessed by Students t-test and was denoted as *= p≤ 0.05, **= p≤ 0.005 from 3 independent assays.
Figure 4
Figure 4. Effect of Gln depletion and SLC1A5 inhibition on cell cycle progression
(A) Representative bright field (20× magnification) images of A549 cells after 48 hours culturing in various growth conditions as described below. (B) DNA histograms of cell cycle phase distribution of 104 cells after 48 hours of culturing A549 cells in growth media supplemented with EGF, insulin, selenium and transferein and 2mM of L-glutamine (+Gln +Sup), or L-glutamine but no supplements (+Gln-Sup), or no L-glutamine but with supplements (−Gln+Supp) or not supplemented with neither L-glutamine not supplements or (+Gln +Sup) in that contain 5mM of GPNA.
Figure 5
Figure 5. Genetic targeting of SLC1A5 affects cell growth and viability
(A) Western blot analysis verification of the down regulation of SLC1A5 protein in A549 and H520 cells transfected with scramble siRNA at 25nM or anti-SLC1A5 with indicated concentrations. After siRNA 72h of transfection, cell viability (B) and cell growth compared to day 0 (C) were analyzed by direct cell count using Trypan Blue dye exclusion method.(D) Cell cycle analysis was performed in A549 cells after 72h of transfection with the indicated siRNA concentrations. The data shown as mean ± SD represent three independent experiments.
Figure 6
Figure 6. SLC1A5-mediated Gln uptake activates mTOR signaling
mTOR, AKT and ERK signaling activation was evaluated using western blot analysis of the phosphorylation of p-mTOR Signaling in H520 (SCC) and H1819 (ADC) cell lines in response to Gln deprivation or SLC1A5 blockade. Cells were deprived of growth factors and L-glutamine (starved) for 24h were treated with RPMI-1640 media that were supplemented EGF, Insulin, selenium and transferein and 2mM of L-glutamine (+Gln+Sup), L-glutamine but no supplements (+Gln-Sup), or no L-glutamine but with supplements (−Gln+Supp) or not supplemented with neither L-glutamine not supplements or the full growth media + 5mM of GPNA (+Gln+Sup) for 60 min. (A) Gln deprivation or GPNA treatment has no effect on mTOR or ERK signaling in H1819 cells (SLC1A5 null). (B) In H520 (SLC1A5 overexpressed) the activation of mTOR signaling cascade was attenuated as evident by the levels of phosphorylated mTOR and the phosphorylation of its p70S6K and p85S6K p. Gln deprivation or GPNA treatment has no effect in either AKT or ERK signaling in H520 cells.

References

    1. Jemal A, Bray F, Center MM, Ferlay J, Ward E, Forman D. Global cancer statistics. CA Cancer J Clin. 2011;61:69–90. - PubMed
    1. Hoffman PC, Mauer AM, Vokes EE. Lung cancer. Lancet. 2000;355:479–485. - PubMed
    1. Carbone DP. Molecular modalities in the treatment of lung cancer. Oncology (Huntingt) 1999;13:142–147. - PubMed
    1. Rikova K, Guo A, Zeng Q, Possemato A, Yu J, Haack H, et al. Global survey of phosphotyrosine signaling identifies oncogenic kinases in lung cancer. Cell. 2007;131:1190–1203. - PubMed
    1. Campa MJ, Wang MZ, Howard B, Fitzgerald MC, Patz EF., Jr Protein expression profiling identifies macrophage migration inhibitory factor and cyclophilin a as potential molecular targets in non-small cell lung cancer. Cancer Res. 2003;63:1652–1656. - PubMed

Publication types

MeSH terms