. 2012 Dec 18;109(51):20814-9.
doi: 10.1073/pnas.1209304109. Epub 2012 Dec 3.

Motor transport of self-assembled cargos in crowded environments

Affiliations

Motor transport of self-assembled cargos in crowded environments

Leslie Conway et al. Proc Natl Acad Sci U S A. .

Abstract

Intracellular transport of cargo particles is performed by multiple motors working in concert. However, the mechanism of motor association to cargos is unknown. It is also unknown how long individual motors stay attached, how many are active, and how multimotor cargos would navigate a densely crowded filament with many other motors. Prior theoretical and experimental biophysical model systems of intracellular cargo have assumed fixed teams of motors transporting along bare microtubules or microtubules with fixed obstacles. Here, we investigate a regime of cargos transporting along microtubules crowded with free motors. Furthermore, we use cargos that are able to associate or dissociate motors as it translocates. We perform in vitro motility reconstitution experiments with high-resolution particle tracking. Our model system consists of a quantum dot cargo attached to kinesin motors, and additional free kinesin motors that act as traffic along the microtubule. Although high densities of kinesin motors hinder forward motion, resulting in a lower velocity, the ability to associate motors appears to enhance the run length and attachment time of the quantum dot, improving overall cargo transport. These results suggest that cargos that can associate new motors as they transport could overcome traffic jams.


Conflict of interest statement

The authors declare no conflict of interest.

Figures

Fig. 1.
Fig. 1.
Kinesin crowding and qualitative effects on Qdot and single GFP-kinesin motility. (A) Representative images of GFP-kinesin coating microtubules at 5, 10, 25, 50, 100, and 200 nM. Due to increasing levels of kinesin, these images are displayed with different linear look-up tables. For 5 and 10 nM, the gray scale is from 0 to 1,000 on 16-bit scale. For 25 nM, the gray scale is from 0 to 2,500. For 50 and 100 nM, the gray scale is from 0 to 5,000. For 200 nM, the gray scale is from 0 to 10,000, which is saturated. Single GFP-kinesin are clearly visible at 5 and 10 nM. (Scale bar, 1 μm.) (B) Linear motor density of GFP-kinesin along the microtubule as a function of added GFP-kinesin to the chamber. Error bars represent SEM for 50 microtubules analyzed for each density. The data fit to a line with one free slope parameter: y = mx. The best fit was achieved when m = 2.9 ± 0.2, which gives a goodness of fit R2 = 0.96. (C) Representative sections of kymographs for Qdot motility in the presence of 1, 25, and 200 nM added kinesin (not the entire kymograph run) on the left with the high-resolution trace on the right. Gray shading indicates periods of pausing determined using the threshold described. (Scale bars: vertical direction, 2 s; horizontal, 0.5 μm.) (D) Representative sections of kymographs for single GFP-kinesin in the presence of 1, 25, and 200 nM added kinesin. (Scale bars: vertical direction, 2 s; horizontal, 0.5 μm.)
Fig. 2.
Fig. 2.
Motility properties of Qdot cargos and single GFP-kinesin motors under increasingly crowded conditions. (A) Velocity was measured in two ways: the overall velocity of each individual cargo such that all pauses were included in the measurement (blue squares) and the velocity of each individual cargo where only the moving portions of the run were measured such that all pause events were omitted from this measurement (red circles). These data show that the drop in velocity observed, as conditions become more crowded, cannot be attributed only to an increase in pausing [1 nM (n = 19); 5 nM (n = 36); 10 nM (n = 138); 25 nM (n = 106); 50 nM (n = 49); 100 nM (n = 22); 200 nM (n = 36)]. Velocity for single GFP-kinesin is shown (green triangles) [1 nM (n = 101); 25 nM (n = 104); 50 nM (n = 55); 75 nM (n = 54); 200 nM (n = 103)]. (B) Run length was measured as the total distance traveled along the microtubule by a Qdot cargo (red circles) [1 nM (n = 19); 5 nM (n = 36); 10 nM (n = 138); 25 nM (n = 106); 50 nM (n = 49); 100 nM (n = 22); 200 nM (n = 36)]. Run length for single GFP-kinesin is shown (green triangles) [1 nM (n = 101), 25 nM (n = 104); 50 nM (n = 55); 75 nM (n = 54); 200 nM (n = 103)]. (C) Association time was measured as the total time that a single cargo spent bound to the microtubule (red circles) [1 nM (n = 19); 5 nM (n = 36); 10 nM (n = 138); 25 nM (n = 106); 50 nM (n = 49); 100 nM (n = 22); 200 nM (n = 36)]. Association time for single GFP-kinesin is shown (green triangles) [1 nM (n = 101); 25 nM (n = 104); 50 nM (n = 55); 75 nM (n = 54); 200 nM (n = 103)]. Error bars represent SEM for all plots.
Fig. 3.
Fig. 3.
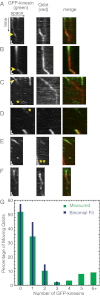
Two-color single-molecule assays show association and dissociation of kinesin motors to Qdots. (A–F) Example kymographs depicting various ways in which Qdots were observed to associate or dissociate GFP-kinesin motors while translocating along the microtubule. Left kymographs show GFP-kinesin motility (green in merge), middle kymographs show Qdot motility (red in merge), and right kymographs show the merge of the two channels. (Scale bars: vertical direction, 10 s; horizontal direction, 0.5 μm.) (A and B) GFP-kinesin motor is observed to associate with a Qdot already bound to the microtubule. A yellow arrowhead indicates GFP-kinesin binding event. (C) GFP-kinesin motor is observed to dissociate from a Qdot while the Qdot is moving along the microtubule. A yellow arrowhead indicates GFP-kinesin dissociation event. (D) Qdot and GFP-kinesin are observed to bind the microtubule simultaneously. Single GFP-kinesin motors traveling on the same microtubule are also observed (*). (E) Qdot and GFP-kinesin are observed to dissociate from the microtubule simultaneously. Unlabeled kinesin motors transport a second Qdot (**). (F) Qdot is observed to bind directly to a GFP-kinesin already bound to the microtubule. (G) Histogram representing the number of GFP-kinesin motors bound to Qdots. The green bars represent data measured from the two-color assays. The blue bars represent the binomial fit used to estimate the number of kinesin binding spots available on the Qdot.
Fig. 4.
Fig. 4.
Characteristics of pausing of Qdot cargos. (A) Percentage of time spent paused is measured as the percentage of time each individual cargo spent paused during its entire association time [1 nM (n = 19); 5 nM (n = 36); 10 nM (n = 138); 25 nM (n = 106); 50 nM (n = 49); 100 nM (n = 22); 200 nM (n = 36)]. Error bars represent SEM. (B) Spatial pause frequency (black circles) and temporal pause frequency (gray circles) are a measure of the average number of times a single cargo pauses per micrometer per run or per second per run, respectively [1 nM (n = 19); 5 nM (n = 36); 10 nM (n = 138); 25 nM (n = 106); 50 nM (n = 49); 100 nM (n = 22); 200 nM (n = 36)]. Error bars represent SEM. (C) Normalized distribution of the pause duration (in seconds) for cargos in the presence of 1 nM (blue circles, line), 25 nM (red squares, line), and 200 nM (green diamonds, line) with exponential decay fits represented by the same color line. Characteristic decay times for each distribution are as follows: 0.21 ± 0.03 s for 1 nM (R2 = 0.92), 0.117 ± 0.007 for 25 nM (R2 = 0.99), and 0.088 ± 0.004 for 200 nM (R2 = 0.995). (D) The decay constant found from the exponential decay fits of C are plotted as a function of kinesin crowding concentration and found to decay linearly with the log of the concentration. We fit the function: y = m (log (C)) + b to the function and found m = −0.037 ± 0.004, b = 0.25 ± 0.006 (R2 = 0.99).
Fig. 5.
Fig. 5.
Crowding and multiple motors on cargos results in short reversal motions. (A) The kymograph depicts the track of a single cargo carried by kinesin-1 in crowded conditions (50 nM kinesin-1). The arrow indicates the point during the run where the cargo reverses. The red line kymograph overlay was generated by the high-resolution tracking program used to analyze all data. Each point represents the localization of the cargo in each frame of the movie. The data were not smoothed. (Scale bars: vertical, 0.5 s; horizontal, 0.5 μm.) (B) The plot shows the percentage of cargos that reverse at least once per run. The 5% dashed line represents the noise floor of our measurement for stationary Qdots. We fit the data to a linear fit of the log of the density of kinesin: y = m*log(x) + b, where m = 8 ± 3 and b = 15 ± 2.

Similar articles

Cited by

References

    1. Ross JL, Ali MY, Warshaw DM. Cargo transport: Molecular motors navigate a complex cytoskeleton. Curr Opin Cell Biol. 2008;20(1):41–47. - PMC - PubMed
    1. Caviston JP, Holzbaur EL. Microtubule motors at the intersection of trafficking and transport. Trends Cell Biol. 2006;16(10):530–537. - PubMed
    1. Chevalier-Larsen E, Holzbaur EL. Axonal transport and neurodegenerative disease. Biochim Biophys Acta. 2006;1762(11–12):1094–1108. - PubMed
    1. Hammond JW, Griffin K, Jih GT, Stuckey J, Verhey KJ. Co-operative versus independent transport of different cargoes by Kinesin-1. Traffic. 2008;9(5):725–741. - PubMed
    1. Beeg J, et al. Transport of beads by several kinesin motors. Biophys J. 2008;94(2):532–541. - PMC - PubMed

Publication types

MeSH terms

LinkOut - more resources