. 2012 Dec 18;109(51):21058-63.
doi: 10.1073/pnas.1214400109. Epub 2012 Dec 3.

Neuregulin 1-HER axis as a key mediator of hyperglycemic memory effects in breast cancer

Affiliations

Neuregulin 1-HER axis as a key mediator of hyperglycemic memory effects in breast cancer

Jiyoung Park et al. Proc Natl Acad Sci U S A. .

Abstract

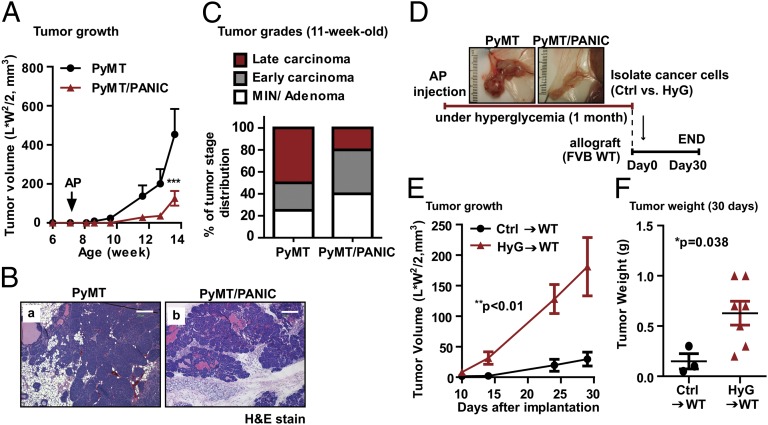
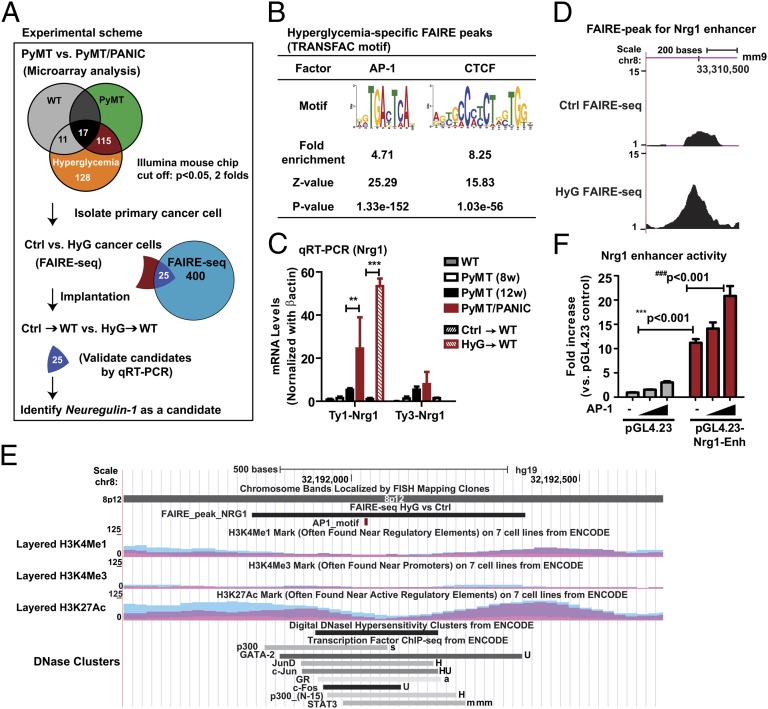
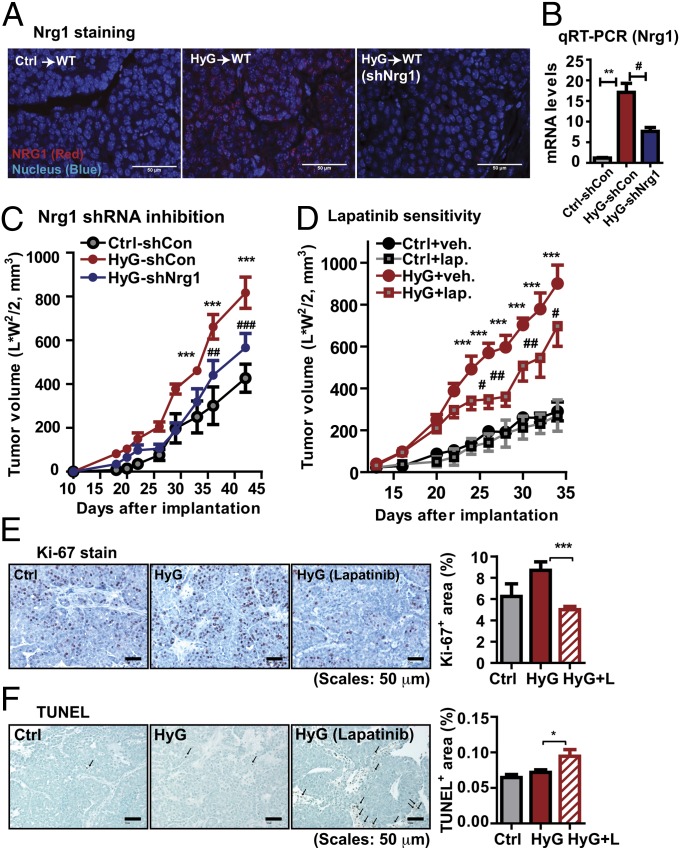
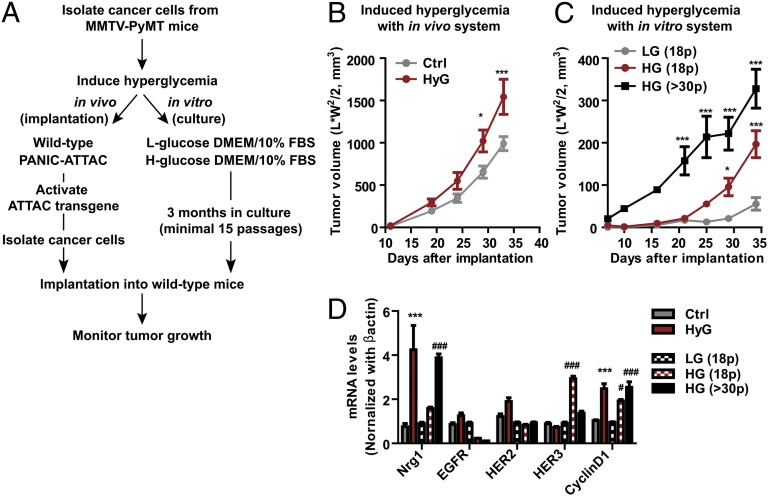
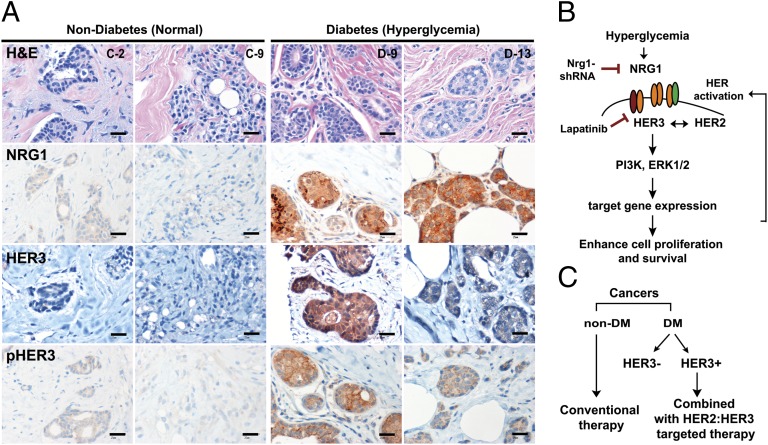
Poor outcomes in diabetic patients are observed across a range of human tumors, suggesting that cancer cells develop unique characteristics under diabetic conditions. Cancer cells exposed to hyperglycemic insults acquire permanent aggressive traits of tumor growth, even after a return to euglycemic conditions. Comparative genome-wide mapping of hyperglycemia-specific open chromatin regions and concomitant mRNA expression profiling revealed that the neuregulin-1 gene, encoding an established endogenous ligand for the HER3 receptor, is activated through a putative distal enhancer. Our findings highlight the targeted inhibition of NRG1-HER3 pathways as a potential target for the treatment breast cancer patients with associated diabetes.


Conflict of interest statement

The authors declare no conflict of interest.

Figures

Fig. 1.
Fig. 1.
Hyperglycemic memory in mammary cancer cells result in the malignant progression. (A) Tumor growth for PyMT and PyMT/PANIC mice. Hyperglycemia was induced by dimerizer injection (AP20187; 0.5 μg/g per day for 5 d by i.p administration) in 7-wk-old PyMT/PANIC mice. Tumor growth was assessed by caliper measurements twice a week. n = 6 per group. ***P < 0.001 vs. PyMT by two-way ANOVA. (B) Representative images of H&E stain for PyMT and PyMT/PANIC. (Scale bars: 200 μm.) (C) Tumor grading was determined by using H&E-stained slides for 11-wk-old PyMT and PyMT/PANIC mice. n = 10 per group. (D) Schematic for the implantation of cancer cells taken from PyMT and PyMT/PANIC into isogenic wild-type hosts. (E and F) Tumor growth for hyperglycemia experienced cancer cells (HyG)-bearing mice compared with control cells (Ctrl)-bearing mice. Either HyG or Ctrl cancer cells (0.5 × 10⁶ per mouse) were implanted into the mammary adipose tissues of wild-type mice and monitored tumor growth by caliper measurement (E). Data represent mean ± SEM (n = 5 per group). **P < 0.01 vs. Ctrl by two-way ANOVA. Tumor weights (F) were determined at 30 d after implantation. *P = 0.038 vs. Ctrl by unpaired Student’s t test.
Fig. 2.
Fig. 2.
Identification of Nrg1 as a candidate gene engaged in the hyperglycemic memory effects in mammary cancer cells. (A) Integrated genomic approach that identified Nrg1. Microarray analysis was performed for RNA from tumors of PyMT/PANIC and PyMT mice as well as from mammary adipose tissues of PANIC-ATTAC and wild-type mice (Fig. S2). The subset of genes specifically modulated by hyperglycemia in tumors was retained for further analysis. Global analysis of open chromatin conformation was performed by FAIRE-seq with primary cancer cells isolated from tumor tissues of PyMT (Ctrl) and PyMT/PANIC (HyG). Twenty-five candidate genes were selected by cross-comparison of microarray data and FAIRE-seq data. qRT-PCR was used to validate the expression of candidate genes in tumors of PyMT/PANIC and PyMT and of HyG and Ctrl xenograft tumors (Fig. S3). (B) Enrichment analysis for AP-1 and CTCF motifs in hyperglycemia-specific FAIRE peaks. (C) qRT-PCR for Nrg1 mRNA levels. β-actin was used as a control. Data represent mean ± SEM **P < 0.01, ***P < 0.001 by two-way ANOVA. n = 6–8 per group. (D) The FAIRE peak in the HyG chromatin indicates a hyperglycemia-specific open chromatin region that may represent an active enhancer for Nrg1. The position of the FAIRE peak in the mouse genome (assembly mm9) in the University of California Santa Cruz (UCSC) Genome Browser is indicated. The y axis represents the number of the normalized FAIRE read frequencies. (E) The homologous region of the putative Nrg1 enhancer in the human genome. The position of the region in the human genome (assembly Hg19) in the UCSC Genome Browser is indicated. The conserved putative AP-1 motif is highlighted in red. Binding regions for multiple transcription factors, the levels of histone modifications and DNaseI hypersensitivity as obtained from ENCODE are shown. (F) Luciferase reporter assay in CHO cells. Enhancer element was inserted in the reporter vector containing a minimal promoter (pGL4.23), and assay was determined at 2 d after transfection in the presence or absence of the AP-1 transcription factor. Data represent mean ± SEM three independent experiments were performed. ***P < 0.001 and ###P < 0.001 by two-way ANOVA.
Fig. 3.
Fig. 3.
Nrg1 acquisition in HyG-tumors enhances tumor malignancy. (A) Nrg1 immunostaining, showing a strong Nrg1 signal in HyG-tumors, but not in Ctrl-tumors. shRNA-mediated Nrg1 knock down in HyG tumors decreases Nrg1 levels. (Scale bars: 50 μm.) (B) Total RNA was prepared from the tumor tissues of scrambled shRNA-infected Ctrl cells (Ctrl-shCon), scrambled shRNA-infected HyG cells (HyG-shCon), and Nrg1 shRNA-infected HyG cells (HyG-shNrg1) bearing mice. mRNA levels for Nrg1 were determined by qRT-PCR. mRNA levels were normalized with β-actin and represented as mean ± SEM (n = 8 per group). **P < 0.01 Ctrl-shCon vs. HyG-shCon; #P < 0.05 vs. HyG-shCon vs. HyG-shNrg1 by unpaired Student’s t test. (C) Tumor growth for the Nrg1 knock downed HyG-tumors, showing a reduced growth rate compared with HyG-tumors. ***P < 0.001 vs. Ctrl-shCon; ##P < 0.01, ###P < 0.001 vs. HyG-shCon by two-way ANOVA. n = 8 per group. (D) Lapatinib treatment (100 mg/kg per day by oral gavage) of HyG-tumor bearing mice, showing that a RTK inhibitor attenuated growth of HyG tumor (n = 10), but less affected of Ctrl tumors (n = 8). ***P < 0.001 vs. Ctrl; #P < 0.05 and ##P < 0.01 vs. HyG by two-way ANOVA. (E) Proliferation indices were determined by Ki-67 staining. Quantified results represent mean ± SEM (n = 5 per group). Three different fields per sample were analyzed. ***P < 0.01 vs. HyG by unpaired Student’s t test. (F) Apoptosis was determined by TUNEL assays. Quantified results represent mean ± SEM (n = 3 per group). Three different fields per sample were analyzed. *P < 0.05 vs. HyG by unpaired Student’s t test.
Fig. 4.
Fig. 4.
High levels of glucose confer malignancy to cancer cells. (A) Schematic diagram of hyperglycemic challenges to primary cancer cells in vivo and in vitro. (B) Upon secondary implantation into euglycemic hosts, tumor growth for hyperglycemia-exposed primary cancer cells originally grown in PANIC-ATTAC mice was faster in comparison with those isolated from wild-type mice. Cancer cells were exposed to hyperglycemia for 1 mo in vivo. Tumor volume represents mean ± SEM (n = 8 per group). *P < 0.05, ***P < 0.001 vs. Ctrl by two-way ANOVA. (C) Primary cancer cells isolated from PyMT mice were cultured with different glucose concentrations [low (LG, 1 g/L) vs. high glucose (HG, 4.5 g/L)] supplemented with 10% FBS for 3 mo (over 15 passages). These cells were then implanted into wild-type mice and tumor growth was monitored. Tumor volume represents mean ± SEM (n = 8–9 per group). *P < 0.05, ***P < 0.001 vs. LG (18 passages) by two-way ANOVA. (D) Total RNA was isolated from cancer cells from tumors grown in PANIC-ATTAC mice (HyG) or wild-type mice (Ctrl) as well as those cultured with either low glucose (18 passages) or high glucose (18 and more than 30 passages) media. mRNA levels for Nrg1, EGFR, HER2, HER3, and cyclinD1 were determined by qRT-PCR. Results represent mean ± SEM (n = 5 per group). ***P < 0.001 vs. Ctrl; #P < 0.05, ###P < 0.001 vs. LG (18p) by two-way ANOVA.
Fig. 5.
Fig. 5.
DM breast cancer patients present a strong NRG1 signal and HER3 activation compared with non-DM patients regardless HER2 status. (A) Representative images for H&E, NRG1, HER3, and pHER3 staining in both groups (C-2 and C-9 for control vs. d-9 and d-13 for DM; Table S1). (Scale bars: 25 μm.) (B) Summary of this study. (C) Proposed therapeutic application for DM-breast cancer patients.

Similar articles

Cited by

References

    1. Barone BB, et al. Long-term all-cause mortality in cancer patients with preexisting diabetes mellitus: A systematic review and meta-analysis. JAMA. 2008;300(23):2754–2764. - PMC - PubMed
    1. Vigneri P, Frasca F, Sciacca L, Pandini G, Vigneri R. Diabetes and cancer. Endocr Relat Cancer. 2009;16(4):1103–1123. - PubMed
    1. Stattin P, et al. Prospective study of hyperglycemia and cancer risk. Diabetes Care. 2007;30(3):561–567. - PubMed
    1. Jee SH, et al. Fasting serum glucose level and cancer risk in Korean men and women. JAMA. 2005;293(2):194–202. - PubMed
    1. Wang ZV, et al. PANIC-ATTAC: A mouse model for inducible and reversible beta-cell ablation. Diabetes. 2008;57(8):2137–2148. - PMC - PubMed

Publication types

MeSH terms

Associated data