. 2012 Dec 18;109(51):E3568-77.
doi: 10.1073/pnas.1205345109. Epub 2012 Dec 3.

G-protein signaling leverages subunit-dependent membrane affinity to differentially control βγ translocation to intracellular membranes

Affiliations

G-protein signaling leverages subunit-dependent membrane affinity to differentially control βγ translocation to intracellular membranes

Patrick R O'Neill et al. Proc Natl Acad Sci U S A. .

Abstract

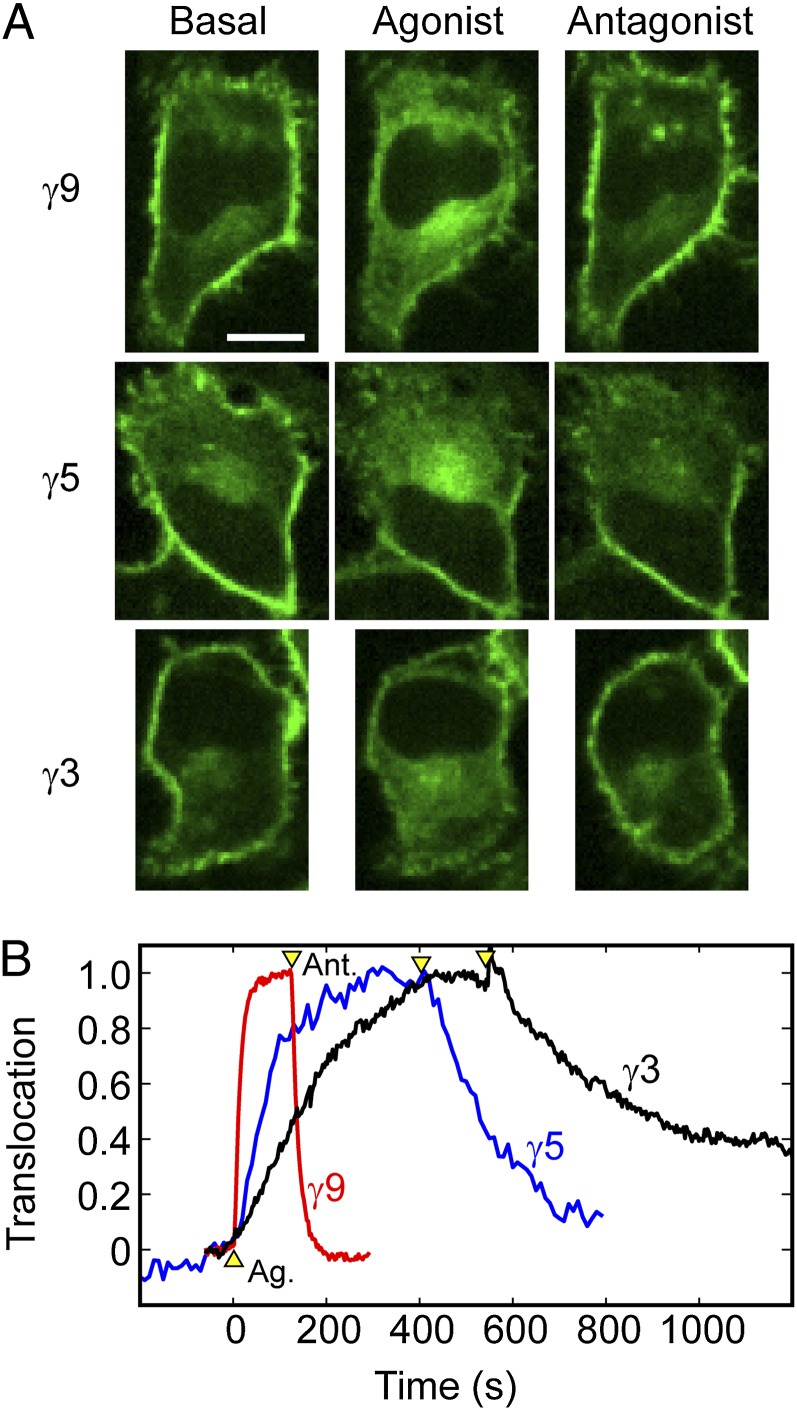
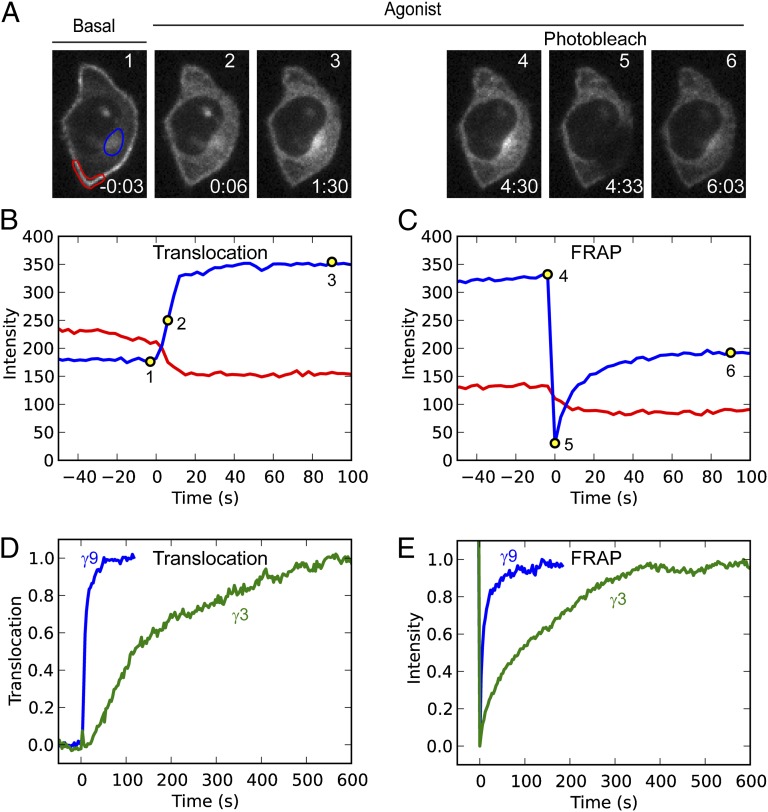
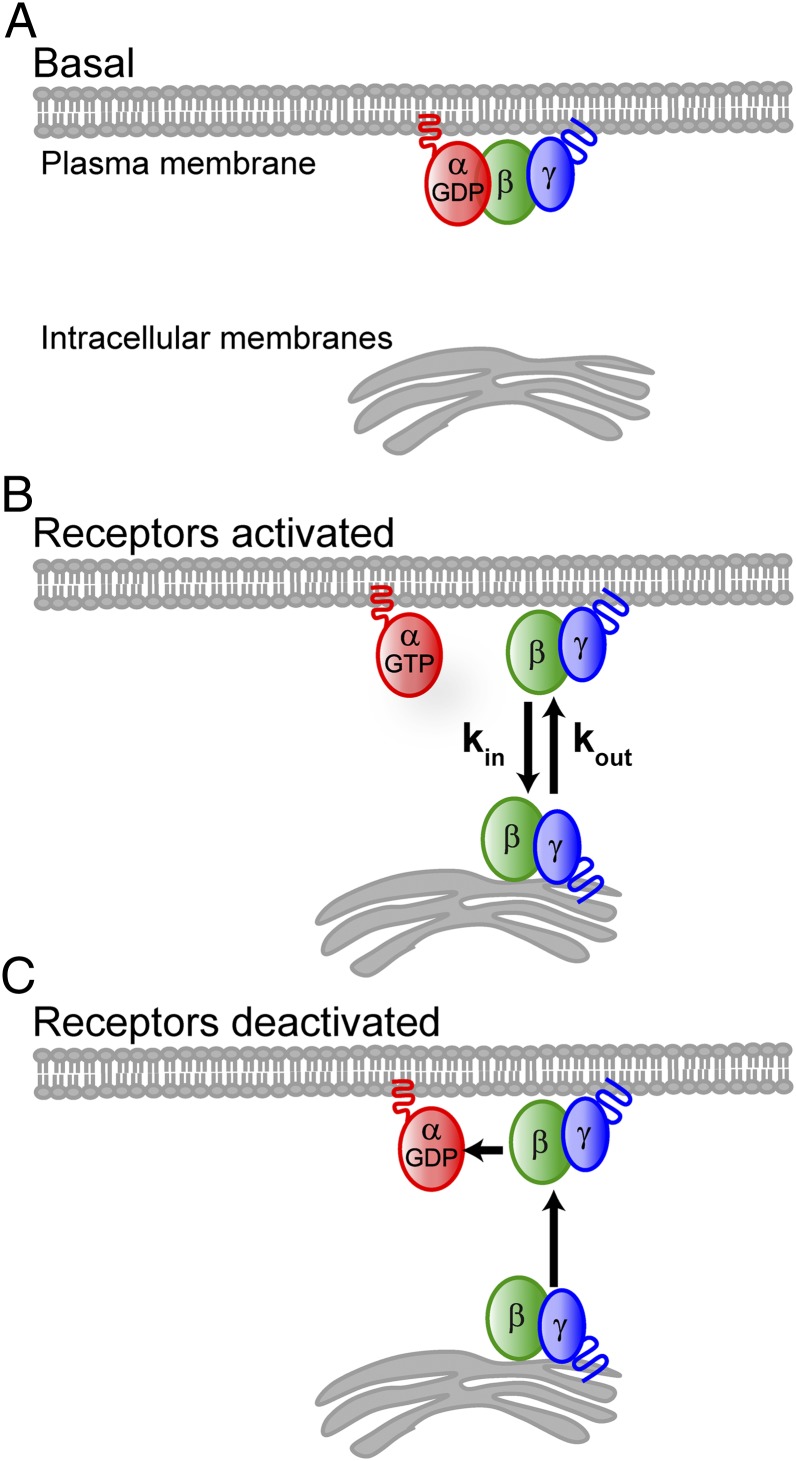
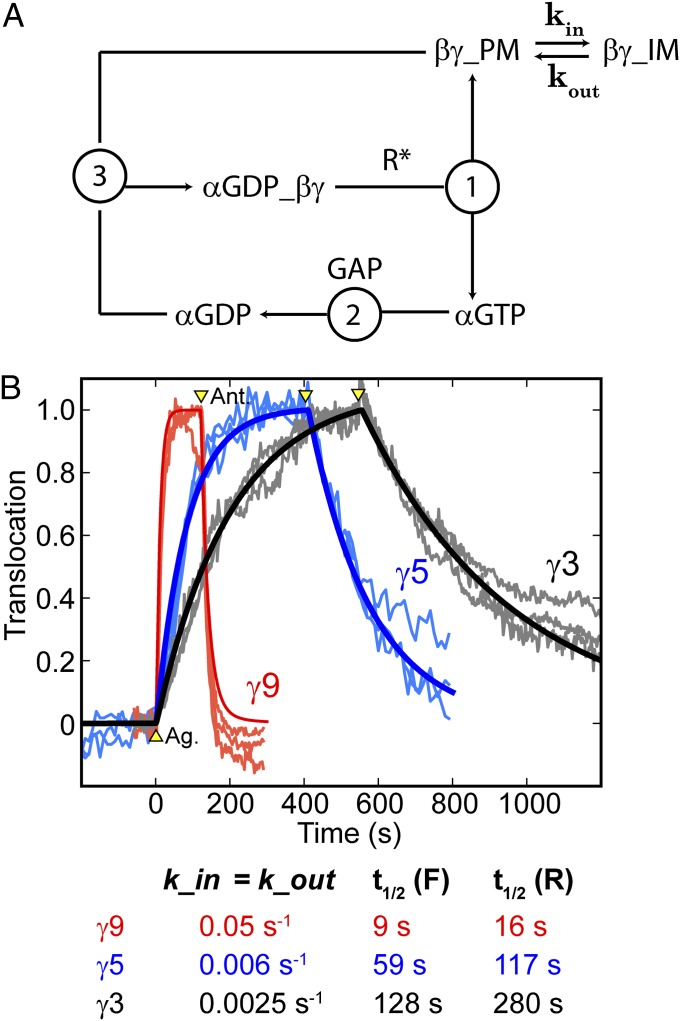
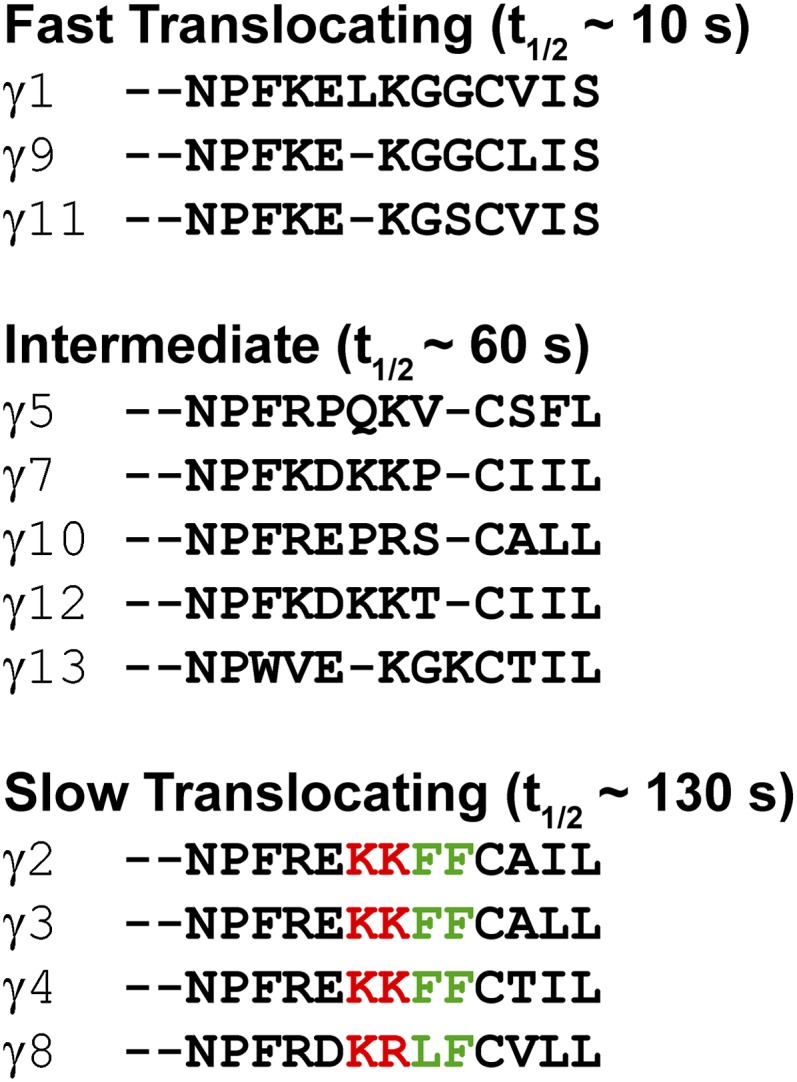
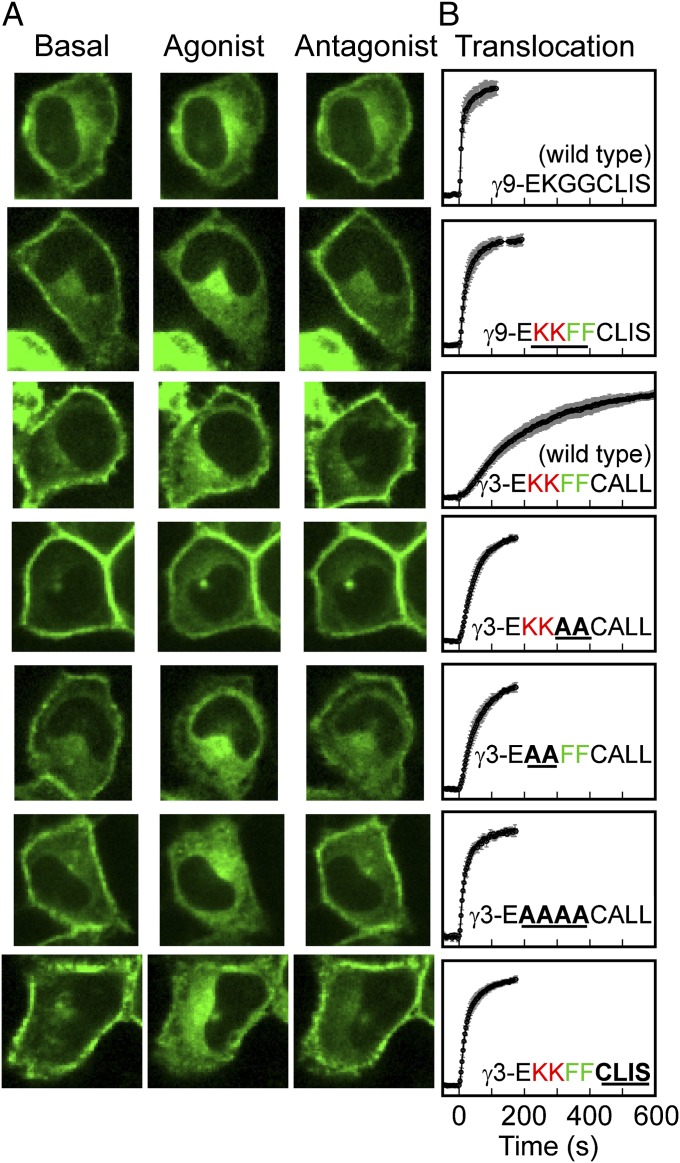
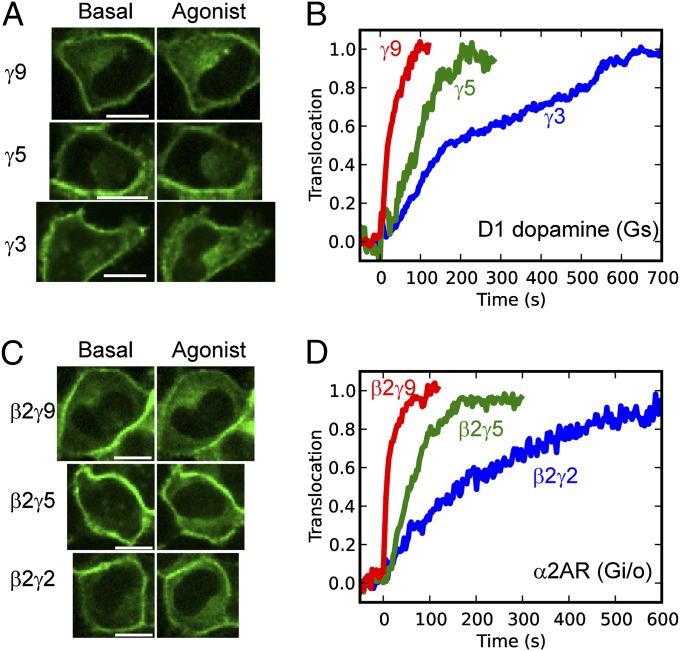
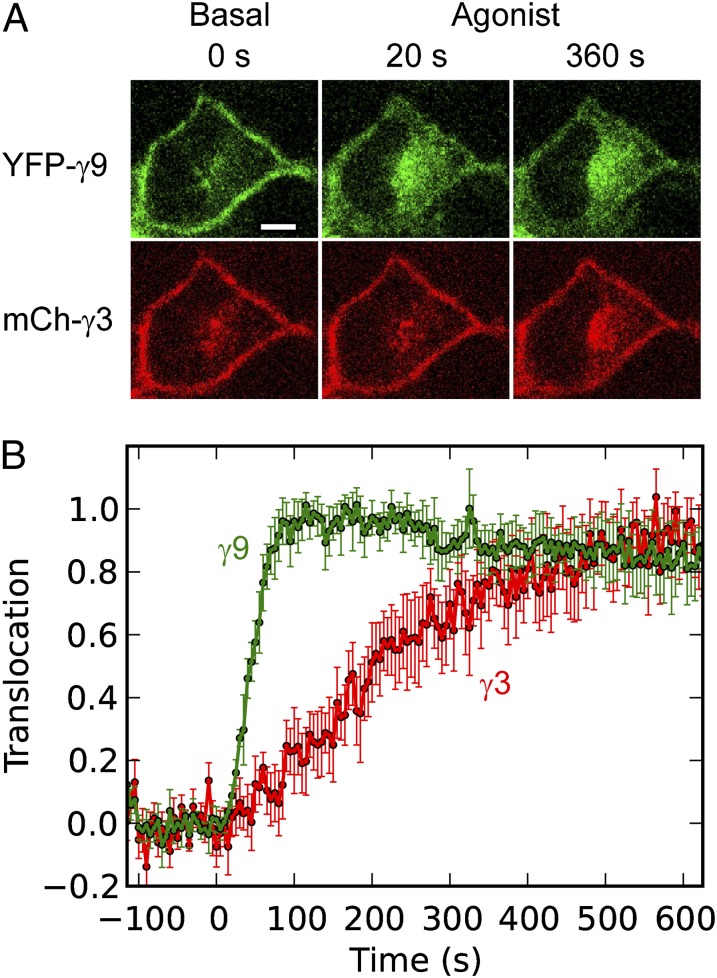
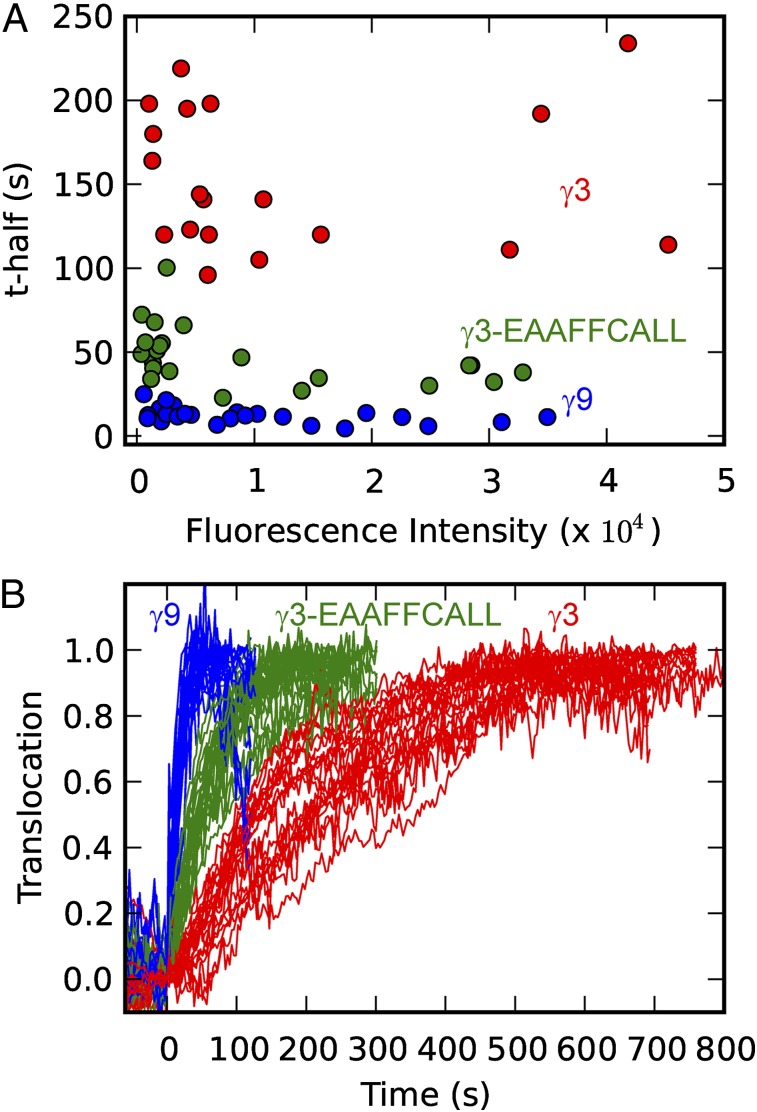
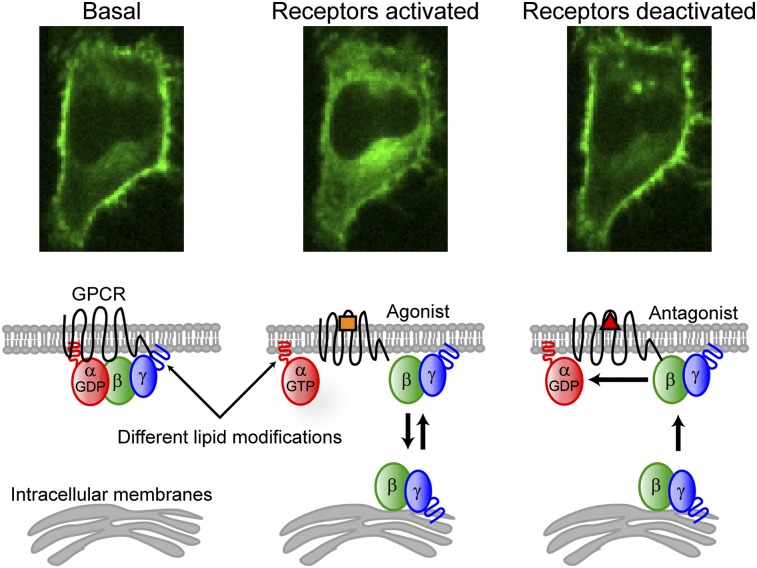
Activation of G-protein heterotrimers by receptors at the plasma membrane stimulates βγ-complex dissociation from the α-subunit and translocation to internal membranes. This intermembrane movement of lipid-modified proteins is a fundamental but poorly understood feature of cell signaling. The differential translocation of G-protein βγ-subunit types provides a valuable experimental model to examine the movement of signaling proteins between membranes in a living cell. We used live cell imaging, mathematical modeling, and in vitro measurements of lipidated fluorescent peptide dissociation from vesicles to determine the mechanistic basis of the intermembrane movement and identify the interactions responsible for differential translocation kinetics in this family of evolutionarily conserved proteins. We found that the reversible translocation is mediated by the limited affinity of the βγ-subunits for membranes. The differential kinetics of the βγ-subunit types are determined by variations among a set of basic and hydrophobic residues in the γ-subunit types. G-protein signaling thus leverages the wide variation in membrane dissociation rates among different γ-subunit types to differentially control βγ-translocation kinetics in response to receptor activation. The conservation of primary structures of γ-subunits across mammalian species suggests that there can be evolutionary selection for primary structures that confer specific membrane-binding affinities and consequent rates of intermembrane movement.


Conflict of interest statement

The authors declare no conflict of interest.

Figures

Fig. 1.
Fig. 1.
Reverse βγ-translocation rates show the same γ-subunit dependence as forward translocation rates. (A) Confocal images of HeLa cells transfected with αo, β1, and FP-tagged γ9, γ5, or γ3. Forward βγ translocation was triggered by activation of endogenous α2AR with 10 μM norepinephrine (agonist). Reverse translocation was triggered by receptor deactivation with 60 μM yohimbine (antagonist). (B) Corresponding forward and reverse translocation kinetics for γ9, γ5, and γ3. Arrowheads mark the addition of agonist and antagonist. To facilitate direct comparison of kinetics, we defined “translocation” as the increase in intracellular fluorescence intensity stimulated by receptor activation, normalized by the maximum intracellular intensity reached. Here and in subsequent figures, images labeled “basal” were captured shortly before agonist addition, and images labeled “agonist” or “antagonist” were captured at some time point after forward or reverse translocation reached steady state. (Scale bar: 20 μm.)
Fig. 2.
Fig. 2.
Free βγ-subunits interact dynamically with membranes. (A) Live cell confocal images of a HeLa cell transfected with αo, β1, and GFP-γ9. Images 1–3: βγ translocation stimulated by activation of endogenous CXCR4 receptors with 100ng/mL SDF-1α. Images 4–6: After the βγ distribution reached a steady state, in the presence of SDF-1α, an intracellular membrane region was photobleached and the recovery in this region was monitored. The time for each image, relative to the addition of SDF-1α, is given in min:s. (B and C) Fluorescence intensity changes at the plasma membrane (red) and intracellular membrane (blue) regions as defined in A, corresponding to translocation (B) and FRAP (C). (D) Representative translocation kinetics for γ9 and γ3. (E) Representative FRAP recovery kinetics for γ9 and γ3.
Fig. 3.
Fig. 3.
Model for βγ translocation. (A) Heterotrimers with lipidated α- and γ-subunits interact stably with the plasma membrane. (B) On receptor activation, the βγ-complex dissociates from the α-subunit. The single prenyl moiety on the γ-subunit facilitates membrane interaction but is insufficient for stable membrane binding of βγ, which diffuses throughout the cytosol and binds transiently to both the plasma membrane and intracellular membranes. A pool of free βγ is available to participate in the G-protein activation cycle at the plasma membrane as long as receptors are active. (C) On receptor deactivation, αGDPβγ heterotrimers rapidly accumulate at the plasma membrane, depleting the intracellular pool of βγ.
Fig. 4.
Fig. 4.
Mathematical model suggests that the same rate-limiting step controls forward and reverse translocation. (A) Schematic showing the processes considered by the model, including (1) heterotrimer activation/dissociation catalyzed by activated receptors (R*), (2) GAP accelerated GTP hydrolysis by the α-subunit, and (3) reassociation of βγ with αGDP. Additionally, the model allows for βγ exchange between the plasma membrane (PM) and intracellular membranes (IM) by considering them as two different compartments. (B) Live cell translocation data for three cells each for γ9 (red), γ5 (blue), and γ3 (gray), including data from Fig. 1B. Translocation curves generated from the model are plotted on top of the live cell data. Arrowheads mark the addition of agonist and antagonist. With the exception of kin and kout, all other parameters were obtained from the literature and fixed at the same values for all three fits. The model reproduced the forward and reverse translocation kinetics of all three γ-subunits, using just a single free parameter (kin = kout), suggesting that forward and reverse translocations share the same rate-limiting step. The values of kin (= kout) used to generate translocation curves from the model are displayed below, along with the resulting t1/2 values for forward (F) and reverse (R) translocation.
Fig. 5.
Fig. 5.
Slowest-translocating γ-subunits share the same C-terminal domain. Shown is sequence alignment of γ-subunit C-terminal domain sequences, grouped by translocation rates. Three of the four slowest-translocating subunits (γ2, -3, and -4) share the same KKFFC(GerGer) C-terminal sequence, and the fourth (γ8) also contains two basic residues, two hydrophobic residues, and a geranygeranylated cysteine.
Fig. 6.
Fig. 6.
Hydrophobic and positively charged residues in the γ-subunit C-terminal domain determine rate of βγ translocation. (A) Confocal images of HeLa cells transfected with αo, β1, and a wild-type or mutant GFP-tagged γ-subunit. The specific γ-subunits are specified in the corresponding plots of the forward translocation kinetics in B. Data are plotted as the mean (±SD) from at least n = 14 cells and three independent experiments. Agonist addition corresponds to t = 0 s.
Fig. 7.
Fig. 7.
γ-Dependent translocation kinetics hold for multiple α- and β-subunit types. (A) Confocal images of HeLa cells transfected with D1 dopamine receptors and FP-γ9, -γ5, or -γ3 subunits. Gs heterotrimers were activated by stimulation of D1 receptors with 1 μM A68930. (B) Translocation kinetics corresponding to the cells shown in A. (C) Confocal images of HeLa cells coexpressing αo, Venus156–239-β2, and one of three different Venus1–155-tagged γ-subunits. Endogenous α2ARs were stimulated with 10 μM norepinephrine. (D) Translocation kinetics corresponding to the cells shown in C. Agonist addition corresponds to t = 0 s. (Scale bars: 20 μm.)
Fig. 8.
Fig. 8.
Differential translocation kinetics hold for multiple γ-subunit types expressed in the same cell. (A) Confocal images of a HeLa cell expressing both YFP-γ9 and mCherry-γ3, showing differential translocation on activation of endogenous CXCR4 receptors with 100 ng/mL SDF-1α. (B) Corresponding translocation kinetics. Data are plotted as the mean (±SD) for n = 8 cells. Agonist addition corresponds to t = 0 s. (Scale bar: 10 μm.)
Fig. 9.
Fig. 9.
βγ translocation exhibits consistent γ-subunit–dependent kinetics over a wide range of GFP-γ expression levels. (A) Dependence of the translocation rate (t1/2) on the mean fluorescence intensity in HeLa cells transfected with GFP-tagged γ9, γ3, or γ3-EAAFFCALL. (B) Translocation curves corresponding to the data in A. Endogenous α2ARs were activated with 10 μM norepinephrine at t = 0 s.
Fig. P1.
Fig. P1.
GPCR-induced reversible translocation of G-protein βγ-subunits. In the basal state, the combination of lipid moieties on the α- and γ-subunits stably binds inactive heterotrimers to the plasma membrane. G-protein activation releases the βγ-complex from the α-subunit. The single lipid group on the γ-subunit imparts transient membrane binding, and free βγ-subunits constantly explore the cytosolic surfaces of the plasma membrane and intracellular membranes. Receptor deactivation leads to reversal of translocation and the accumulation of inactive heterotrimers at the plasma membrane.

Similar articles

Cited by

References

    1. Vartak N, Bastiaens P. Spatial cycles in G-protein crowd control. EMBO J. 2010;29(16):2689–2699. - PMC - PubMed
    1. Fivaz M, Meyer T. Reversible intracellular translocation of KRas but not HRas in hippocampal neurons regulated by Ca2+/calmodulin. J Cell Biol. 2005;170(3):429–441. - PMC - PubMed
    1. Hamm HE. The many faces of G protein signaling. J Biol Chem. 1998;273(2):669–672. - PubMed
    1. Akgoz M, Kalyanaraman V, Gautam N. Receptor-mediated reversible translocation of the G protein betagamma complex from the plasma membrane to the Golgi complex. J Biol Chem. 2004;279(49):51541–51544. - PubMed
    1. Azpiazu I, Akgoz M, Kalyanaraman V, Gautam N. G protein betagamma11 complex translocation is induced by Gi, Gq and Gs coupling receptors and is regulated by the alpha subunit type. Cell Signal. 2006;18(8):1190–1200. - PMC - PubMed

Publication types

MeSH terms

LinkOut - more resources