. 2012 Dec 18;109(51):21046-51.
doi: 10.1073/pnas.1218750110. Epub 2012 Dec 3.

Direct and immune mediated antibody targeting of ERBB receptors in a colorectal cancer cell-line panel

Affiliations

Direct and immune mediated antibody targeting of ERBB receptors in a colorectal cancer cell-line panel

Shazad Q Ashraf et al. Proc Natl Acad Sci U S A. .

Abstract

A significant proportion of colorectal cancer (CRC) patients are resistant to anti-ERBB1 [avian erythroblastic leukemia viral (v-erb-b) oncogene homolog, receptor for EGF] monoclonal antibodies (Mabs). We evaluated both immune and nonimmune effects of cetuximab (anti-ERBB1 Mab), trastuzumab (anti-ERBB2 Mab), pertuzumab (anti-ERBB2 Mab), and lapatinib (dual ERBB1 and ERBB2 tyrosine kinase inhibitor) in a large well-characterized panel of 64 CRC cell lines to find response predictive tumor characteristics. There was a significant correlation between the direct effects of cetuximab and lapatinib. Both agents were associated (P = 0.0004) with "triple' wild-type status in KRAS, BRAF, and PIK3CA exon 20. Most cell lines were resistant to the direct effects of anti-ERBB2 Mabs, suggesting that the effects of lapatinib might mainly be through ERBB1. Microarray mRNA expression profiles of sensitive and resistant cell lines showed that although ERBB1 receptor or ligand levels did not associate with cetuximab sensitivity, high levels of ERBB2 (P = 0.036) and amphiregulin (P = 0.026) predicted sensitivity to lapatinib. However, higher ERBB1 expression predicted susceptibility to cetuximab-induced antibody-dependent cellular cytotoxicity and occurred independently of KRAS/BRAF/PIK3CA mutations (P = 0.69). Lapatinib may be an effective alternative therapy to cetuximab in triple wild-type tumors. Microarray analysis provides suggestive biomarkers for resistance. ERBB1 levels, independent of mutation status, predict immune killing. Therefore, anti-ERBB1 antibodies may be considered in CRC tumors with higher ERBB1 expression and favorable FcγR polymorphisms.


Conflict of interest statement

The authors declare no conflict of interest.

Figures

Fig. 1.
Fig. 1.
Direct growth inhibition of CRC cell lines by cetuximab and lapatinib. The SRB assay was used to determine the growth response of CRC cell lines to cetuximab (1 × 10⁻⁴ − 1 × 10² μg/mL) over three doubling times. Representative plots for up to seven different cell lines from each cetuximab response category are shown. Three categories were identified: (A) resistant, (B) partially responsive, and (C) sensitive. There was a highly significant correlation (D) between cetuximab and lapatinib response (Spearman correlation, r = 0.7421, P < 0.0001) in the cell-line panel.
Fig. 2.
Fig. 2.
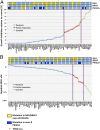
KRAS/BRAF/PIK3CA mutations associate with resistance to cetuximab and lapatinib. Rank plot of the CRC cell-line panel according to sensitivity to (A) cetuximab (calculated as the percentage of growth inhibition relative to control) and (B) lapatinib (calculated as GI50, μM). The presence (yellow shade) or absence (light-blue shade) of mutations in KRAS/NRAS, BRAF (V600E), PIK3CA exon 20 (H1047L/H1047R), and loss of PTEN expression (indicated by asterisk) are also displayed above the plots. PIK3CA exon 9 (E542K/E545K) mutations were not associated with cetuximab resistance (dark-blue shade).
Fig. 3.
Fig. 3.
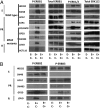
Effects of cetuximab on downstream phosphorylation events. Immunoblotting was used to determine the effects of EGF on ERBB1 (tyrosine-1173) and ERK1/2 (threonine 202/tyrosine 204) in nine cell lines with varying sensitivity to cetuximab. HDC82 and SW48 were sensitive (S); HCA7, CAR1, COLO678, GP2D, and SW403 were partial responders (PR); LOVO and HCT116 were resistant (R). HDC82, SW48, HCA7, and CAR1 are WT for KRAS/BRAF/PIK3CA, whereas the remainder have codons 12/13 KRAS mutations. E−, E+, C−, C+ refer to the absence or presence of EGF and cetuximab respectively. (A) EGF increased ERBB1 phosphorylation (P-ERBB1) in all sensitive and resistant cell lines apart from HCA7. Preincubation with cetuximab reduced tyrosine phosphorylation in all cell lines. ERK1/2 phosphorylation (P-ERK1/2) was stimulated in all of the responsive but not resistant cell lines after EGF stimulation. Preincubation with cetuximab reduced P-ERK1/2 only slightly in HDC82, SW48 and COLO678 with no real reduction in CAR1, GP2D, and SW403. No effect was seen in HCT116 and LOVO. (B) The effects of EGF on ERBB2 (tyrosine 1221/1222) and ERBB3 (tyrosine 1289) phosphorylation (P-ERBB2 and P-ERBB3) were also investigated (all cell lines expressed ERBB2 and ERBB3). Addition of EGF resulted in increased P-ERBB2 in HDC82, SW48, GP2D, and LOVO with significant residual activity in the presence of cetuximab in all these cell lines apart from LOVO. A similar effect was seen with P-ERBB3 in GP2D. No P-ERBB3 was seen in SW48, a cell line with low ERBB3 expression.
Fig. 4.
Fig. 4.
Differential GPR98, PRKAA2, and DOCK4 mRNA expression in CRC cell lines. (A–C) Box-and-whiskers plots of GPR98, PRKAA2, and DOCK4 mRNA expression in triple WT CRC cells that were resistant (group 1) or sensitive (group 2) to the effects of cetuximab. The y axis represents the mRNA level with the values plotted on a log2 scale. The bottom and top of the boxes represent the 25th and 75th percentiles, respectively; the whiskers represent the 10th to the 90th percentiles.
Fig. 5.
Fig. 5.
Immune-mediated killing of CRC cell lines in the presence of cetuximab and trastuzumab. (A) Cells with different levels of ERBB1 were used as targets. Unfractionated PBMC cells were used at an effector:target ratio of 40:1. Cetuximab caused ADCC in a concentration dependent manner (0.001–1μg/mL), particularly in ERBB1 high (SW48, CAR1, COLO678, and SKCO1) cell lines. This was also seen in ERBB1 intermediate (HT29, HCT116, CCK81, and HCA46) cell lines but to a lesser degree. The effect was negligible in negative cell lines (COLO320DM and RKO). (B) ADCC strongly correlated with the ERBB1 expression levels. (C) Trastuzumab is able to mediate ADCC of ERBB2+ CRC cell lines (COLO678, HCA46, and SW48) but not in lines that lacked ERBB2-expression (CCO7 and SW620). The y axis represents percentage of specific lysis and the x axis represents log (antibody) concentration (μg/mL). (D) There was no significant (NS) difference in the level of ADCC (1μg/mL cetuximab) measured in KRAS/BRAF/PIK3CA WT and mutant cell lines (Mann–Whitney test, P = 0.69).

Similar articles

Cited by

References

    1. Messersmith WA, Ahnen DJ. Targeting EGFR in colorectal cancer. N Engl J Med. 2008;359(17):1834–1836. - PubMed
    1. Van Cutsem E, et al. Cetuximab plus irinotecan, fluorouracil, and leucovorin as first-line treatment for metastatic colorectal cancer: Updated analysis of overall survival according to tumor KRAS and BRAF mutation status. J Clin Oncol. 2011;29(15):2011–2019. - PubMed
    1. De Roock W, et al. KRAS, BRAF, PIK3CA, and PTEN mutations: Implications for targeted therapies in metastatic colorectal cancer. Lancet Oncol. 2011;12(6):594–603. - PubMed
    1. Walther A, et al. Genetic prognostic and predictive markers in colorectal cancer. Nat Rev Cancer. 2009;9(7):489–499. - PubMed
    1. Carter PJ. Potent antibody therapeutics by design. Nat Rev Immunol. 2006;6(5):343–357. - PubMed

Publication types