. 2012 Dec 18;109(51):20919-24.
doi: 10.1073/pnas.1209891109. Epub 2012 Dec 3.

Transition paths, diffusive processes, and preequilibria of protein folding

Affiliations

Transition paths, diffusive processes, and preequilibria of protein folding

Zhuqing Zhang et al. Proc Natl Acad Sci U S A. .

Abstract

Fundamental relationships between the thermodynamics and kinetics of protein folding were investigated using chain models of natural proteins with diverse folding rates by extensive comparisons between the distribution of conformations in thermodynamic equilibrium and the distribution of conformations sampled along folding trajectories. Consistent with theory and single-molecule experiment, duration of the folding transition paths exhibits only a weak correlation with overall folding time. Conformational distributions of folding trajectories near the overall thermodynamic folding/unfolding barrier show significant deviations from preequilibrium. These deviations, the distribution of transition path times, and the variation of mean transition path time for different proteins can all be rationalized by a diffusive process that we modeled using simple Monte Carlo algorithms with an effective coordinate-independent diffusion coefficient. Conformations in the initial stages of transition paths tend to form more nonlocal contacts than typical conformations with the same number of native contacts. This statistical bias, which is indicative of preferred folding pathways, should be amenable to future single-molecule measurements. We found that the preexponential factor defined in the transition state theory of folding varies from protein to protein and that this variation can be rationalized by our Monte Carlo diffusion model. Thus, protein folding physics is different in certain fundamental respects from the physics envisioned by a simple transition-state picture. Nonetheless, transition state theory can be a useful approximate predictor of cooperative folding speed, because the height of the overall folding barrier is apparently a proxy for related rate-determining physical properties.


Conflict of interest statement

The authors declare no conflict of interest.

Figures

Fig. 1.
Fig. 1.
FPT and tTP illustrated using model 2CI2 simulated at the transition midpoint. (A) The TP (red trace) is the last part of an example folding trajectory (FP, black trace plus red trace) with an FPT ≈ 2.7 × 10⁷. The rest of the equilibrium fluctuation is shown in gray. (B) The TP in A plotted in an expanded horizontal scale shows that the model protein makes a transition from QD = 0.122 to QN = 1 during a tTP ≈ 4.6 × 10⁴.
Fig. 2.
Fig. 2.
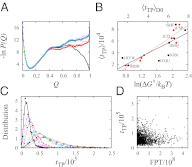
FPT and tTP distributions. (A) Thermodynamic and kinetic FP profiles for model 2CI2. The simulated equilibrium free energy profile −lnPeq(Q) + c (where c is a vertical shift; in the text) and the kinetic −lnPFP(Q) and −lnPFP|s(Q) profiles are shown, respectively, by the black curve and the thin blue and red curves (c = −0.30). The corresponding nonexplicit-chain −lnPFP(Q) and −lnPFP|s(Q) profiles obtained by MC simulations with an effective constant D0 are shown by the thick blue and red curves (results from the Metropolis and Kawasaki algorithms are nearly identical). As expected, the thick blue curve coincides with the analytically derived −lnPFP(Q) profile for constant diffusive coefficient D0 (green curve). (B) Scatter plots of the explicit-chain simulated ‹tTP› (in units of Langevin time steps) with (i) the nonexplicit-chain MC simulated ‹tTPD0 by assuming a constant D0 (red data points; top horizontal scale) (Fig. S2C; in units defined in the caption for Table S2) and (ii) a quantity in the Szabo formula quoted in ref. (black data points; bottom horizontal scale) for the eight proteins studied, where ΔG is the thermodynamic free energy barrier in the explicit-chain model (Table S2). The red and black lines are the least-squares fits, with r = 0.94 and r = 0.78, respectively, for the data points plotted in the same color. (C) TPT distributions. For every protein, the range of simulated tTP values was divided into 20 bins of equal size, ΔtTP. The simulated probability density is then provided by the normalized population of each bin divided by ΔtTP (shown here as data points). The continuous curves are two-parameter fits of the simulated tTP/105 values to equation 31 in the work by Malinin and Chernyak (47), and the fitted parameters are given in Fig. S2. (D) Scatter plot of explicit chain-simulated tTP vs. FPT for model 2CI2 (r = −0.034).
Fig. 3.
Fig. 3.
Transition paths are atypical. For each protein and as functions of Q, Upper shows the contact order ratio ‹COTP›/‹COFP›; Lower shows ‹[ΔPc(Q)]2› = ∑i,j [PTP,ij(Q) – PFP,ij(Q)]2/n along TPs (red curve) and the corresponding deviation ∑i,j [PFP,ij(Q) – PFP,ij(Q)]2/Q˜n along FPs (black curve). The range of Q for each panel is the Q value for the given model protein. The dotted lines in A mark the Q values considered in Fig. 4 for 2CI2.
Fig. 4.
Fig. 4.
Comparing TP and FP contact patterns. Residue numbers are represented by the horizontal and vertical axes; the contact probability or difference in contact probabilities for residue pair i,j is depicted by a small square at position i,j that is color coded according to the scale on the right. Results are for 2CI2. For each Q value considered, PTP,ij(Q) – PFP,ij(Q) values are shown by the upper left contact map; whereas the PFP,ij(Q) values are provided by the lower right contact map. For Q = 0.2, 0.3, 0.4, and 0.55 here, the mean square deviation ∑i,j [PTP,ij(Q) – PFP,ij(Q)]2/Q˜n = 0.0024, 0.015, 0.0047, and 0.000066, respectively.
Fig. 5.
Fig. 5.
Preexponential (front) factors in protein folding. Simulated logarithmic folding rates (lnkf) of the eight proteins (vertical scale, −ln MFPT) in our explicit-chain model are plotted against various measures of the folding barrier (horizontal scale): (i) βΔG = −ln[Peq(Q)/Peq(QD)] (●), (ii) −lnPeq(Q) (○), (iii) −lnPFP(Q) (◇), (iv) −ln[PFP(QδQ) + PFP(Q) + PFP(Q + δQ)] (▲), (v) −ln[PFP(Q − 2δQ) + PFP(QδQ) + PFP(Q) + PFP(Q + δQ) + PFP(Q + 2δQ)] (△), (vi) −lnPFP|s(Q) (■), (vii) −ln[PFP|s(QδQ) + PFP|s(Q) + PFP|s(Q + δQ)] (♦), (viii) −ln[PFP|s(Q − 2δQ) + PFP|s(QδQ) + PFP|s(Q) + PFP|s(Q + δQ) + PFP|s(Q + 2δQ)] (□). The lines are least-squares fits to the simulated data points. Each line is plotted in the same color as the set of data points to which it fits. For barrier measures iviii, the fitted slope = −0.95, −1.00, −0.93, −0.93, −0.93, −1.04, −1.04, and −1.05, respectively; the fitted y intercept = −10.7, −7.22, −7.30, −8.32, −8.79, −7.18, −8.33, and −8.86, respectively (r ≥ 0.996 for all fits). Inset shows the scatter plot of the simulated front factor F (in reciprocal time steps) computed using folding barrier i vs. the front factor KD0 (left vertical scale, arbitrary unit) deduced by our constant D0 MC simulation (black filled circles; r = 0.5) as well as vs. the explicit-chain simulated ‹tTP› in Fig. 2B (red open circles; right vertical scale, r = 0.22).

Similar articles

Cited by

References

    1. Ikai A, Tanford C. Kinetic evidence for incorrectly folded intermediate states in the refolding of denatured proteins. Nature. 1971;230(5289):100–102. - PubMed
    1. Tsong TY, Baldwin RL, Elson EL. The sequential unfolding of ribonuclease A: Detection of a fast initial phase in the kinetics of unfolding. Proc Natl Acad Sci USA. 1971;68(11):2712–2715. - PMC - PubMed
    1. Eyring H. The activated complex in chemical reactions. J Chem Phys. 1935;3:107–115.
    1. Matthews CR. Effect of point mutations on the folding of globular proteins. Methods Enzymol. 1987;154:498–511. - PubMed
    1. Fersht AR, Matouschek A, Serrano L. The folding of an enzyme. I. Theory of protein engineering analysis of stability and pathway of protein folding. J Mol Biol. 1992;224(3):771–782. - PubMed

Publication types