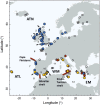
A legacy of contrasting spatial genetic structure on either side of the Atlantic-Mediterranean transition zone in a marine protist
- PMID: 23213247
- PMCID: PMC3529037
- DOI: 10.1073/pnas.1214398110
A legacy of contrasting spatial genetic structure on either side of the Atlantic-Mediterranean transition zone in a marine protist
Abstract
The mechanisms that underpin the varied spatial genetic structures exhibited by free-living marine microorganisms remain controversial, with most studies emphasizing a high dispersal capability that should redistribute genetic diversity in contrast to most macroorganisms whose populations often retain a genetic signature of demographic response to historic climate fluctuations. We quantified the European phylogeographic structure of the marine flagellate Oxyrrhis marina and found a marked difference in spatial genetic structure, population demography, and genetic diversity between the northwest Atlantic and Mediterranean Sea that reflects the persistent separation of these regions as well as context-dependent population responses to contrasting environments. We found similar geographic variation in the level of genetic diversity in the sister species Oxyrrhis maritima. Because the capacity for wide dispersal is not always realized, historic genetic footprints of range expansion and contraction persist in contemporary populations of marine microbes, as they do in larger species. Indeed, the well-described genetic effects of climatic variation on macroorganisms provide clear, testable hypotheses about the processes that drive genetic divergence in marine microbes and thus about the response to future environmental change.
Conflict of interest statement
The authors declare no conflict of interest.
Figures


References
-
- Azam F, Malfatti F. Microbial structuring of marine ecosystems. Nat Rev Microbiol. 2007;5(10):782–791. - PubMed
-
- Finlay BJ. Global dispersal of free-living microbial eukaryote species. Science. 2002;296(5570):1061–1063. - PubMed
-
- Fenchel T, Finlay B. The ubiquity of small species: Patterns of local and global diversity. Bioscience. 2004;54(8):777–784.
-
- Šlapeta J, López-García P, Moreira D. Global dispersal and ancient cryptic species in the smallest marine eukaryotes. Mol Biol Evol. 2006;23(1):23–29. - PubMed
-
- Lowe CD, Montagnes DJS, Martin LE, Watts PC. Patterns of genetic diversity in the marine heterotrophic flagellate Oxyrrhis marina (Alveolata: Dinophyceae) Protist. 2010a;161(2):212–221. - PubMed
Publication types
MeSH terms
Substances
LinkOut - more resources
Full Text Sources

