. 2012 Dec 26;109(52):21498-503.
doi: 10.1073/pnas.1214415110. Epub 2012 Dec 4.

Topological specificity and hierarchical network of the circadian calcium rhythm in the suprachiasmatic nucleus

Affiliations

Topological specificity and hierarchical network of the circadian calcium rhythm in the suprachiasmatic nucleus

Ryosuke Enoki et al. Proc Natl Acad Sci U S A. .

Abstract

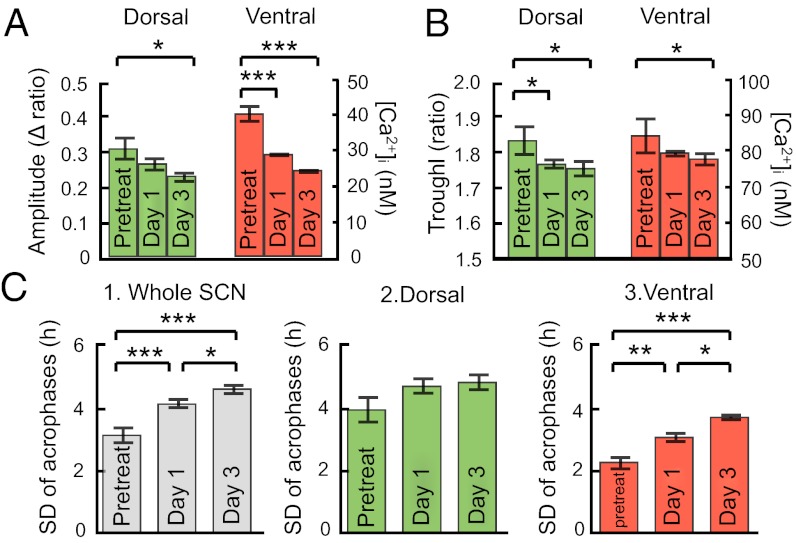
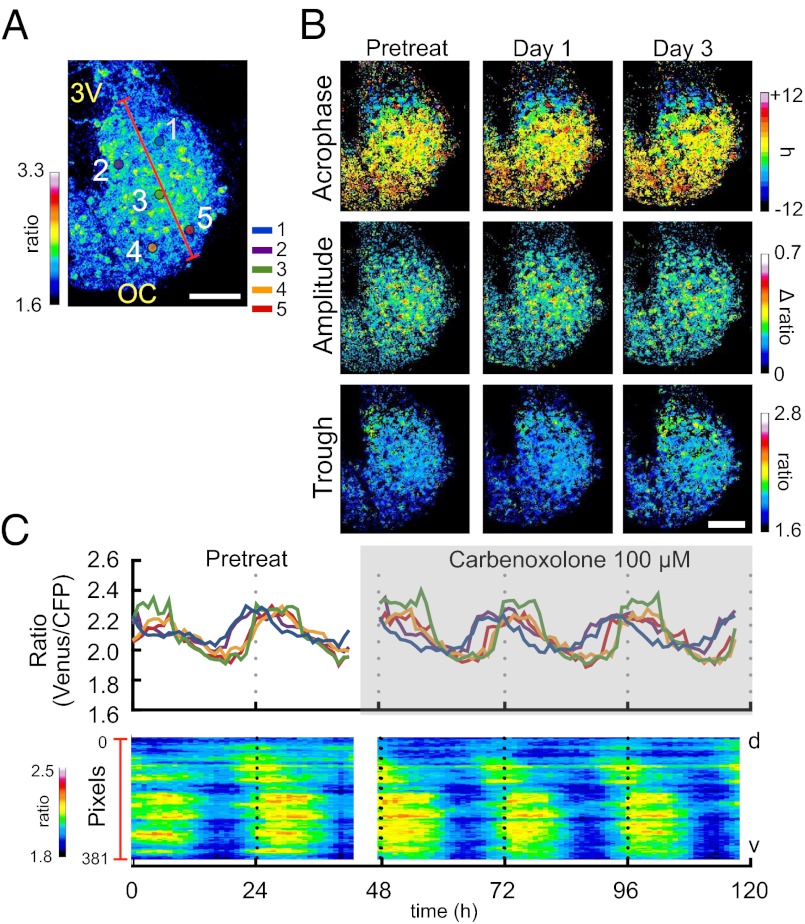
The circadian pacemaker in the hypothalamic suprachiasmatic nucleus (SCN) is a hierarchical multioscillator system in which neuronal networks play crucial roles in expressing coherent rhythms in physiology and behavior. However, our understanding of the neuronal network is still incomplete. Intracellular calcium mediates the input signals, such as phase-resetting stimuli, to the core molecular loop involving clock genes for circadian rhythm generation and the output signals from the loop to various cellular functions, including changes in neurotransmitter release. Using a unique large-scale calcium imaging method with genetically encoded calcium sensors, we visualized intracellular calcium from the entire surface of SCN slice in culture including the regions where autonomous clock gene expression was undetectable. We found circadian calcium rhythms at a single-cell level in the SCN, which were topologically specific with a larger amplitude and more delayed phase in the ventral region than the dorsal. The robustness of the rhythm was reduced but persisted even after blocking the neuronal firing with tetrodotoxin (TTX). Notably, TTX dissociated the circadian calcium rhythms between the dorsal and ventral SCN. In contrast, a blocker of gap junctions, carbenoxolone, had only a minor effect on the calcium rhythms at both the single-cell and network levels. These results reveal the topological specificity of the circadian calcium rhythm in the SCN and the presence of coupled regional pacemakers in the dorsal and ventral regions. Neuronal firings are not necessary for the persistence of the calcium rhythms but indispensable for the hierarchical organization of rhythmicity in the SCN.


Conflict of interest statement

The authors declare no conflict of interest.

Figures

Fig. 1.
Fig. 1.
Topological characterization of the circadian calcium rhythm. (A) Pseudocolor image of YC 3.60 signals in the SCN slice. 3V, third ventricle; OC, optic chiasm. The image was taken near the peak phase of the rhythm. (B) Hourly montage of circadian signals in four representative areas. (Scale bar, 10 µm.) Left images show the locations of individual neurons. (C, Left) signal intensity of individual neurons over time (72 h). A horizontal bar indicates the time when the montage of images was collected. (Right) Raster plots of signal intensity across the dorsal tip to the end of ventral region as indicated by a red line in A. (D) Mapping of rhythm parameters: 1, Acrophase map: peak phase time is depicted and normalized relative to the mean phase of the whole slice; 2, period map; 3, amplitude map; 4, Trough map. (E) Bihourly images of the acrophase distribution. Black pixels indicate those with acrophase in this bin. Number on the upper margin of the top panel indicates the difference from the mean acrophase of the whole slice (h). Estimated borders of the SCN and the dorsal/ventral regions are shown as broken lines. (Scale bars, 100 µm all panels except B).
Fig. 2.
Fig. 2.
Statistical comparison of circadian rhythm parameters in different SCN regions. (A) SD of phase distribution in the whole, dorsal, and ventral SCN. Period (B), amplitude (C), and trough level (D) in the dorsal and ventral SCN are demonstrated as the mean ± SD. The estimated calcium concentration is shown on the right of graph in C and D. *P < 0.05, **P < 0.01. n = 5 slices.
Fig. 3.
Fig. 3.
TTX affects the calcium rhythm and disrupts synchronization. (A) YC 3.60 signals in a representative SCN slice at the peak phase of calcium rhythm on the pretreat day. (B) Image of the SCN immunolabeled with AVP and VIP antibodies. (C, Upper) Changes in the signal intensity of YC 3.60 over time (142 h) in three individual neurons, the location of which is indicated in A. (Lower) Raster plots of calcium rhythm from the dorsal tip to the end of ventral region as indicated by a red line in A. The arrowhead is the approximate boundary between the two regions. (D) Mapping of the rhythm parameters before and during TTX application. (Scale bars, 100 µm.)
Fig. 4.
Fig. 4.
Statistical comparison of TTX effects. Effect of TTX on the (A) amplitude, (B) trough, and (C) distribution of phase expressed in SD are analyzed on the pretreat, first day, and third day of TTX treatment. Data are expressed as the mean ± SD *P < 0.05, **P < 0.01, ***P < 0.001. n = 4 slices. See legend of Fig. 2 for details.
Fig. 5.
Fig. 5.
Enlargement of phase difference between the dorsal and ventral regions by TTX. (A) Bihourly images of the acrophase distribution before (pretreat) and during TTX application. The estimated borders of the SCN and the dorsal/ventral regions are shown as broken lines. Number on the upper margin of the Top panel indicates the difference from the mean acrophase (h). Data were obtained from the same SCN as displayed in Fig. 3. (Scale bar, 100 µm.) (B) Acrophase distribution expressed in histogram on the pretreat, first, and third day of TTX application. Histograms are normalized relative to the mean phase of the whole slice. (C) Histogram of the acrophase distribution within the dorsal and ventral regions in all four slices examined. The y axis is normalized to the peak of each region in a slice. Note that dispersion of two peaks is clear following TTX application (arrowheads).
Fig. 6.
Fig. 6.
Effect of calbenoxolone on the calcium rhythm and network synchronization. (A) YC 3.60 signals in a representative SCN slice near the peak phase of calcium rhythm on the pretreat. (B) Maps of the circadian rhythm parameters before and during CBX application in an SCN. (C, Upper) Circadian calcium rhythms before (pretreat) and during CBX treatment (shadowed area). Circadian calcium rhythms of four individual cells, indicated in A, demonstrate that gap-junction blocking has no significant effect on any circadian parameter of calcium rhythms. (Lower) Raster plots of calcium rhythm from the dorsal tip to the end of ventral region as indicated by a red line in A. See legend of Fig. 1 for details. (Scale bars, 100 µm.)
Fig. 7.
Fig. 7.
Statistical comparison of calbenoxolone effects. Effect of CBX on amplitude (A), trough (B), and the SD of acrophases (C) on the pretreat, first, and third day of CBX treatment are shown for the whole, dorsal, and ventral SCN. Data are expressed as the mean ± SD of three SCN slices. *P < 0.05.

References

    1. Moore RY, Eichler VB. Loss of a circadian adrenal corticosterone rhythm following suprachiasmatic lesions in the rat. Brain Res. 1972;42(1):201–206. - PubMed
    1. Welsh DK, Takahashi JS, Kay SA. Suprachiasmatic nucleus: Cell autonomy and network properties. Annu Rev Physiol. 2010;72:551–577. - PMC - PubMed
    1. Reppert SM, Weaver DR. Coordination of circadian timing in mammals. Nature. 2002;418(6901):935–941. - PubMed
    1. Webb AB, Angelo N, Huettner JE, Herzog ED. Intrinsic, nondeterministic circadian rhythm generation in identified mammalian neurons. Proc Natl Acad Sci USA. 2009;106(38):16493–16498. - PMC - PubMed
    1. Liu AC, et al. Intercellular coupling confers robustness against mutations in the SCN circadian clock network. Cell. 2007;129(3):605–616. - PMC - PubMed

Publication types

LinkOut - more resources