. 2012 Dec 18;109(51):21028-33.
doi: 10.1073/pnas.1211427109. Epub 2012 Dec 4.

Positive intergenic feedback circuitry, involving EBF1 and FOXO1, orchestrates B-cell fate

Affiliations

Positive intergenic feedback circuitry, involving EBF1 and FOXO1, orchestrates B-cell fate

Robert Mansson et al. Proc Natl Acad Sci U S A. .

Abstract

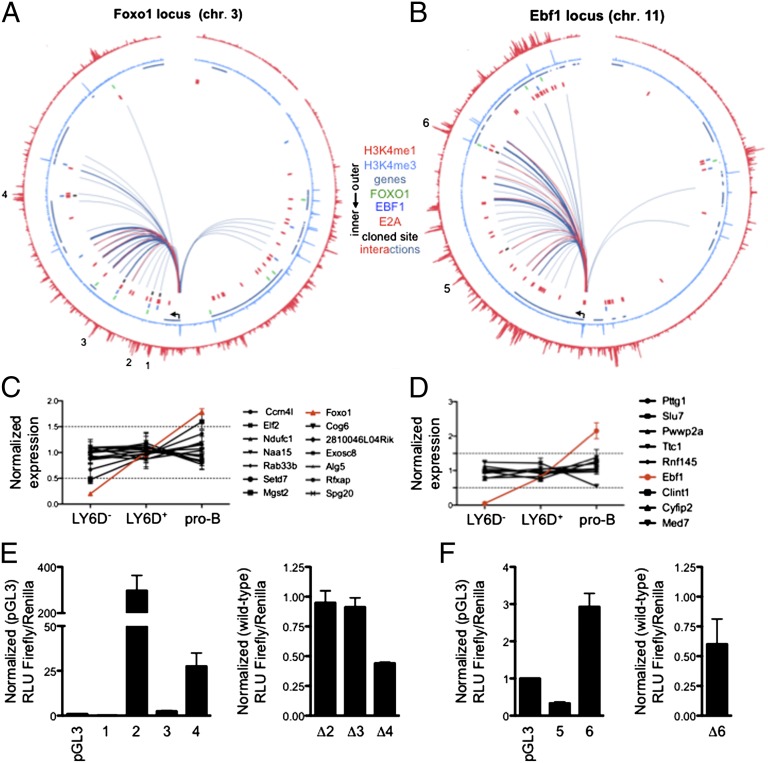
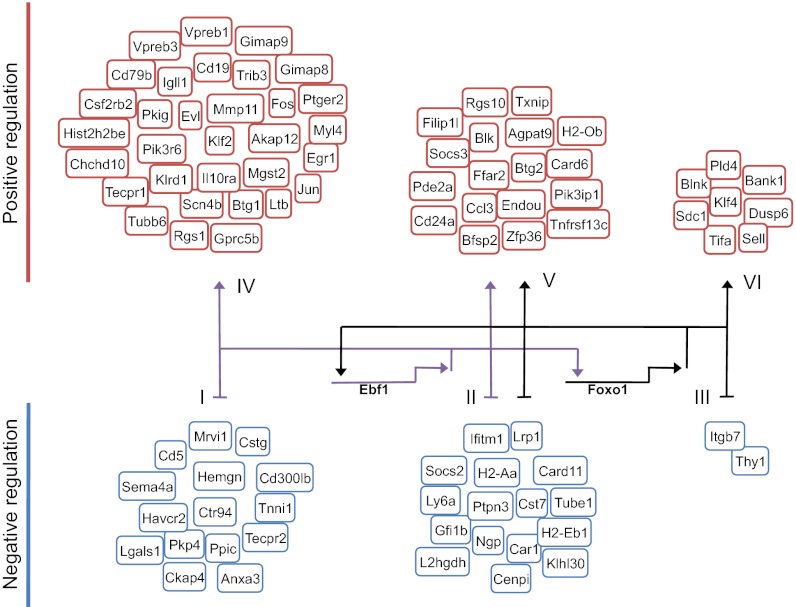
Recent studies have identified a number of transcriptional regulators, including E2A, early B-cell factor 1 (EBF1), FOXO1, and paired box gene 5 (PAX5), that promote early B-cell development. However, how this ensemble of regulators mechanistically promotes B-cell fate remains poorly understood. Here we demonstrate that B-cell development in FOXO1-deficient mice is arrested in the common lymphoid progenitor (CLP) LY6D(+) cell stage. We demonstrate that this phenotype closely resembles the arrest in B-cell development observed in EBF1-deficient mice. Consistent with these observations, we find that the transcription signatures of FOXO1- and EBF1-deficient LY6D(+) progenitors are strikingly similar, indicating a common set of target genes. Furthermore, we found that depletion of EBF1 expression in LY6D(+) CLPs severely affects FOXO1 mRNA abundance, whereas depletion of FOXO1 activity in LY6D(+) CLPs ablates EBF1 transcript levels. We generated a global regulatory network from EBF1 and FOXO1 genome-wide transcription factor occupancy and transcription signatures derived from EBF1- and FOXO1-deficient CLPs. This analysis reveals that EBF1 and FOXO1 act in a positive feedback circuitry to promote and stabilize specification to the B-cell lineage.


Conflict of interest statement

The authors declare no conflict of interest.

Figures

Fig. 1.
Fig. 1.
FOXO1 plays an essential role in B-cell development. (A) LY6D and LY6D+ CLPs were analyzed by real-time PCR for the abundance of Foxo1 mRNA. Values were normalized to HPRT expression and shown as mean ± SEM, using cells from two independent sorts. (B) Total number of BM cells in sex- and age-matched WT and FOXO1−/− mice. Data shown are pooled from two independent experiments. (C) (Left) Representative FACS plots of CD19+B220+ cells derived from WT and FOXO1−/− BM. (Right) Total numbers of CD19+B220+ B cells isolated from WT and FOXO1−/− BM. Data shown are pooled from two independent experiments. (D) (Left) Representative FACS plots showing gating strategy to identify CLPs. LINneg includes CD11B, GR1, TER119, LY6C, NK1.1, CD3e, CD19, and CD11C. (Right) Numbers of LY6D and LY6D+ CLPs in WT and FOXO1−/− mice. Data shown are pooled from two independent experiments. (E) Representative FACS plots displaying reconstitution of CD45.2+ cells in CD45.1+ hosts, isolated from WT (Upper) and FOXO1−/− (Lower) BM. (Left) LY6D+/− CLPs. (Center) CD19+B220+ BM B cells. (Right) CD19+B220+ spleen B cells. (F) Diagram displaying the roles of transcription factors in early hematopoiesis and B-cell progenitors.
Fig. 2.
Fig. 2.
FOXO1 acts to enforce B-cell fate (A) Graph shows the distribution of DH-JH rearrangements in LY6D+ CLPs. A total of 192 cells/genotype from two independent sorts were assayed. Cells were scored as follows: GL only, germ-line band only; DJ + GL, cells producing one DHJH and one GL DNA fragments; DJ, cells producing one or two DHJH DNA fragments and no GL band; no read out, cells failing to produce detectable PCR products. (B) Graph displays cloning frequency from OP9-coculture experiments using single cell–sorted LY6D+ CLPs derived from WT and FOXO1−/− mice. Cells were cultured in B/NK cell promoting culture conditions. Indicated are percentages of clones containing cells expressing CD19, NK1.1, and/or CD11C. A total of 264 cells per genotype were sorted. (C) Graphs display cloning frequency from OP9-DL1 coculture experiments using single-sorted LY6D (Left) and LY6D+ (Right) CLPs isolated from WT and FOXO1−/− mice. Shown are the mean ± SEM. A total of 192 cells/genotype were sorted in two independent experiments. (D) Result from microarrays analysis displaying genes that are changed by a factor of twofold between WT and FOXO1−/− LY6D+ CLPs. Displayed data are derived from two microarray replicas using cells from independent sorts. (E) LY6D+ CLPs from WT and FOXO1−/− mice were analyzed by real-time PCR for the abundance of the indicated transcripts. Values were normalized for HPRT expression and are shown as mean ± SEM using mRNA from two independent sorts. (F) Multiplex single cell RT-PCR from LY6D+ CLPs. Graph indicates the percentages of cells expressing the indicated genes. A total of 96 cells were assayed for each genotype.
Fig. 3.
Fig. 3.
FOXO1 and EBF1 share a common set of target genes. (A) Results from microarray analysis showing the normalized expression of Foxo1, Ebf1, Igll1, and Vpreb1 in Ly6D+/− CLPs and pro-B cells. Genotypes are indicated below graphs. (B) Result from microarrays analysis displaying genes that are changed at least twofold between either WT and FOXO1−/− and/or WT and EBF1−/− LY6D+ CLPs. Data are derived from two microarray replicas using material from independent sorts. (C) Plots show the direction of gene regulation in FOXO1- and EBF1-deficient cells of genes in B. Gene expression was normalized to the average expression of the WT and KO value for each set of WT/KO arrays. (D) Functional classification of genes in B. (E) Distance in the genome from the TSS of genes changed in FOXO1−/− LY6D+ CLPs to closest FOXO1/EBF1 binding sites.
Fig. 4.
Fig. 4.
An intergenic feeback circuitry, involving FOXO1 and EBF1, establishes B-cell identity. (A and B) Circos diagram displaying genomic interactions across a 5-Mb genomic region surrounding the (A) Foxo1 and (B) Ebf1 locus (arrows indicate Foxo1/Ebf1 transcriptional start sites). H3K4me1/3 binding patterns and FOXO1/EBF1/E2A binding sites from pro-B cells are indicated. The thicknesses of the connecting lines reflect the natural log ratio of observed versus expected interaction frequency in the Hi-C data sets. Bin size used for analysis of genomic interactions was 50 kb. Blue and red connecting lines represent significant interactions observed in pro-B and pre-pro-B cells, respectively. (C and D) Expression and developmental regulation of genes located within ±3 Mb surrounding the (C) Foxo1 and (D) Ebf1 TSSs, respectively. Expression was normalized to the average of developmental stages displayed. (E) (Left) Transcriptional activity of putative enhancer elements surrounding the Foxo1 locus with associated EBF1 occupancy. (Right) Transcriptional activity after mutation (Δ) of binding sites (Fig. S4). (F) (Left) Transcriptional activity of putative enhancer elements surrounding the Ebf1 locus with associated FOXO1 occupancy. (Right) Transcriptional activity after mutation (Δ) of binding sites (Fig. S5). Luciferase data shown are mean ± SEM derived from two independent experiments.
Fig. 5.
Fig. 5.
Global regulatory network that orchestrates B-cell fate. Network is based on the transcription signatures derived from EBF1- and FOXO1-deficient CLPs and genome-wide EBF1 and FOXO1 occupancy in pro-B cells. Intergenic feedback circuitry is indicated. Genes were selected with a significant change in transcript levels in EBF1- or FOXO1-ablated LY6D+ CLPs (at least a twofold change) and with a TSS proximal and distal (<250 kb) EBF1/FOXO1 occupancy. Genes fulfilling these criteria were divided into six groups: I, negatively regulated by EBF1; II, negatively regulated by both EBF1 and FOXO1; III, negatively regulated by FOXO1; IV, positively regulated by EBF1; V, positively regulated by EBF1 and FOXO1; VI, positively regulated by FOXO1.

References

    1. Adolfsson J, et al. Identification of Flt3+ lympho-myeloid stem cells lacking erythro-megakaryocytic potential: A revised road map for adult blood lineage commitment. Cell. 2005;121(2):295–306. - PubMed
    1. Kondo M, Weissman IL, Akashi K. Identification of clonogenic common lymphoid progenitors in mouse bone marrow. Cell. 1997;91(5):661–672. - PubMed
    1. Karsunky H, Inlay MA, Serwold T, Bhattacharya D, Weissman IL. Flk2+ common lymphoid progenitors possess equivalent differentiation potential for the B and T lineages. Blood. 2008;111(12):5562–5570. - PMC - PubMed
    1. Inlay MA, et al. Ly6d marks the earliest stage of B-cell specification and identifies the branchpoint between B-cell and T-cell development. Genes Dev. 2009;23(20):2376–2381. - PMC - PubMed
    1. Mansson R, et al. Single-cell analysis of the common lymphoid progenitor compartment reveals functional and molecular heterogeneity. Blood. 2010;115(13):2601–2609. - PubMed

Publication types

Associated data