. 2012 Dec 18;109(51):21116-21.
doi: 10.1073/pnas.1210047110. Epub 2012 Dec 4.

Human seizures self-terminate across spatial scales via a critical transition

Affiliations

Human seizures self-terminate across spatial scales via a critical transition

Mark A Kramer et al. Proc Natl Acad Sci U S A. .

Abstract

Why seizures spontaneously terminate remains an unanswered fundamental question of epileptology. Here we present evidence that seizures self-terminate via a discontinuous critical transition or bifurcation. We show that human brain electrical activity at various spatial scales exhibits common dynamical signatures of an impending critical transition--slowing, increased correlation, and flickering--in the approach to seizure termination. In contrast, prolonged seizures (status epilepticus) repeatedly approach, but do not cross, the critical transition. To support these results, we implement a computational model that demonstrates that alternative stable attractors, representing the ictal and postictal states, emulate the observed dynamics. These results suggest that self-terminating seizures end through a common dynamical mechanism. This description constrains the specific biophysical mechanisms underlying seizure termination, suggests a dynamical understanding of status epilepticus, and demonstrates an accessible system for studying critical transitions in nature.


Conflict of interest statement

The authors declare no conflict of interest.

Figures

Fig. 1.
Fig. 1.
Brain electrical activity approaching seizure termination observed across spatial scales. Example multiscale voltage traces recorded simultaneously in the scalp EEG, surface ECoG, LFP, and MUA in the approach to seizure termination (vertical dashed line). The abrupt transition from ictal (dark gray) to postictal (white) may exhibit early warning signatures of a critical transition. The activity in each trace has been scaled to permit visual comparison.
Fig. 2.
Fig. 2.
Critical transition signatures—decreased oscillation frequency and increased correlations—approaching seizure termination. (A) Example of power spectrum (i), autocorrelation (AC) distribution (ii), and 2D spatial correlation (SC, iii) of ECoG data versus time (T) in the approach to seizure termination (vertical blue line). To characterize these distributions, a line is fit (gray) to the mean values over time for each measure (Materials and Methods). (B) Population results for the slope of the linear fits to the frequency of mean power, or mean temporal and spatial correlations, approaching seizure termination. For most measures and spatial scales in EEG, surface ECoG(S), depth ECoG(D), LFP, and MUA, the slopes differ significantly from zero. Black lines indicate the SEM, and asterisks indicate levels of significance; see P values in B and in text. Spatial correlations are not computed for the ECoG(D) recordings that lack a 2D electrode grid configuration. Red bars indicate the spatial correlations computed for surrogate data.
Fig. 3.
Fig. 3.
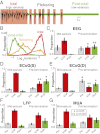
Multiscale voltage data flicker between ictal and postictal states approaching seizure termination. (A) Example of flickering in ECoG data preceding seizure termination. Between the ictal (light red) and postictal (green) states, signatures of both states appear. (B) Proportion of signal variance during ictal (red), flickering (orange), and postictal (green) intervals. The flickering interval exhibits a broad variance distribution with two peaks. (CG) The proportion of variance vectors classified as preictal (gray), ictal (red), and postictal (green) in two periods: mid-seizure and pretermination. For the EEG (C), surface ECoG (D), and depth ECoG (E), the changes in classification from ictal to postictal are significant. For the LFP (F) and MUA (G), similar trends exists but are not significant.
Fig. 4.
Fig. 4.
Summary of critical transition signatures determined at each spatial scale. The scalp EEG and ECoG data (shaded in gray) display all four warning signs of an impending critical transition approaching seizure termination. Spatial correlations are not meaningful for the depth ECoG [i.e., ECoG (D)] recordings. The MUA exhibit only slowing rhythmic activity, as observed across all spatial scales in the approach to seizure termination.
Fig. 5.
Fig. 5.
Computational model of seizure termination mimics the observed dynamics. (A) Cartoon illustration of the transition from ictal to postictal in the mean-field model. At low connection strength (A, i), all dynamics (black) approach the ictal attractor (red). Bistability precedes the discontinuous critical transition (A, ii); dynamics outside the separatrix (gray) approach the ictal attractor, and dynamics inside the separatrix approach the postictal attractor (green). After the critical transition (A, iii), only the postictal attractor remains. (Lower) Simulated voltage traces illustrate the model dynamics in each case. During the interval of bistability (A, ii), flickering occurs between the ictal (red shading) and postictal (green shading) states. (B) Fits to the slope of the frequency of mean power, mean temporal correlations, and mean spatial correlations for a population of field oscillators as connectivity strength increases. In all cases, the values differ significantly from zero. Surrogate data do not yield notable spatial correlations in the model. (C) Bifurcation diagram of the self-connected mean-field model (SI Appendix, Mean Field Model) reveals a region of bistability. One model variable, the main observable formula image, is plotted versus the bifurcation parameter C, the connection strength. At weaker connection strengths, the only attractor consists of stable limit cycles (l.c.), which correspond to large-amplitude oscillations characteristic of the ictal state (shaded light red). Increased connection strength (“C” on the x axis) induces bistability (yellow interval) in which another attractor appears, a branch of stable fixed points (f.p.). At the critical transition (blue circles) the bistability is lost and the only stable attractor becomes the branch of fixed points (shaded green). (D) Proportion of variance vectors classified as preictal (gray), ictal (red), and postictal (green) in an intermediate-connectivity (mid-seizure) and high-connectivity (pretermination) state for the population of mean-field oscillators. Flickering manifests in the pre-termination interval as significant changes in the proportions of ictal and postictal classifications.
Fig. 6.
Fig. 6.
Outline of potential seizure termination scenarios. The solid black line highlights the computational model implemented here, in which the critical transition (Top) is implemented through a specific dynamical mechanism (examples in the Middle) and biophysical mechanism (examples at the Bottom). Many prospective biophysical mechanisms exist, each potentially associated with multiple types of dynamical mechanisms or even principles at the macroscopic spatial scale and perhaps with different dynamical mechanisms at the microscopic spatial scale.
Fig. 7.
Fig. 7.
Status epilepticus represents failure to cross the seizure critical transition. (A) Cartoon illustration of status epilepticus dynamics. As a self-terminating seizure progresses from ictal attractor to postictal attractor (solid black line, as in Fig. 5), the separatrix (gray ellipse) enlarges, eventually colliding with the ictal attractor (red ellipse) at the critical transition. In status epilepticus, the system approaches the critical transition but repeatedly retreats toward regions that support the ictal attractor (orange lines). (B and C) Examples of frequency of mean power (red) and mean autocorrelation (black) for four self-terminating seizures (B), during status epilepticus (C, Upper), and in the model (C, Lower). The self-terminating seizures are brief compared with status epilepticus. In all cases, visual inspection suggests anticorrelation between the two measures. Vertical scale bars indicate SD from the mean. (D) The cross-correlation (gray) between the two measures for the clinical and simulated status epilepticus data in C reveals anticorrelation at zero lag and rhythmicity. The black curves indicate 1.5 times the expected SD computed using the Bartlett estimator (42). (E) The cross-correlation at zero lag for patients with status epilepticus (n = 5, label “status”; mean: −0.41, SEM 0.07) and scalp EEG and surface ECoG data for self-limited seizures (n = 23, label “seizure”; mean: −0.40, SEM 0.1) is negative.

References

    1. Schindler K, Elger CE, Lehnertz K. Increasing synchronization may promote seizure termination: Evidence from status epilepticus. Clin Neurophysiol. 2007;118(9):1955–1968. - PubMed
    1. Lado FA, Moshé SL. How do seizures stop? Epilepsia. 2008;49(10):1651–1664. - PMC - PubMed
    1. Kullmann DM, Semyanov A. Glutamatergic modulation of GABAergic signaling among hippocampal interneurons: Novel mechanisms regulating hippocampal excitability. Epilepsia. 2002;43(Suppl 5):174–178. - PubMed
    1. Bragin A, Penttonen M, Buzsáki G. Termination of epileptic afterdischarge in the hippocampus. J Neurosci. 1997;17(7):2567–2579. - PMC - PubMed
    1. Fröhlich F, Bazhenov M, Timofeev I, Sejnowski TJ. Maintenance and termination of neocortical oscillations by dynamic modulation of intrinsic and synaptic excitability. Thalamus Relat Syst. 2005;3(2):147–156. - PMC - PubMed

Publication types