. 2012:2:918.
doi: 10.1038/srep00918. Epub 2012 Dec 4.

Disparate roles of marrow- and parenchymal cell-derived TLR4 signaling in murine LPS-induced systemic inflammation

Affiliations

Disparate roles of marrow- and parenchymal cell-derived TLR4 signaling in murine LPS-induced systemic inflammation

Justin E Juskewitch et al. Sci Rep. 2012.

Abstract

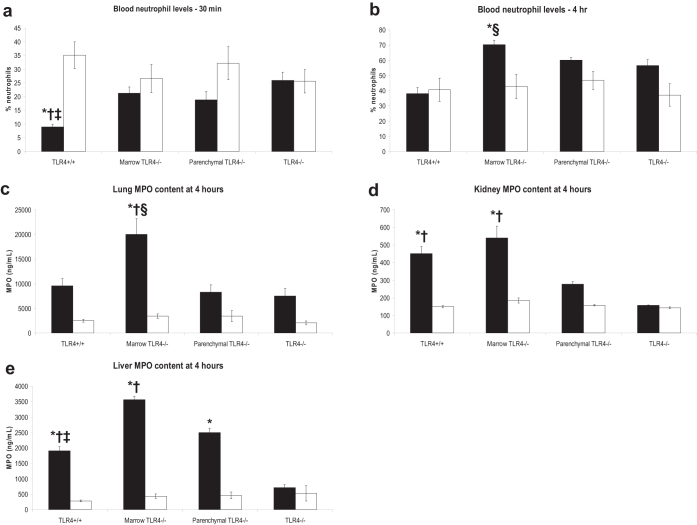
Systemic inflammatory response syndrome (SIRS) occurs in a range of infectious and non-infectious disease processes. Toll-like receptors (TLRs) initiate such responses. We have shown that parenchymal cell TLR4 activation drives LPS-induced systemic inflammation; SIRS does not develop in mice lacking TLR4 expression on parenchymal cells. The parenchymal cell types whose TLR4 activation directs this process have not been identified. Employing a bone marrow transplant model to compartmentalize TLR4 signaling, we characterized blood neutrophil and cytokine responses, NF-κB1 activation, and Tnf-α, Il6, and Ccl2 induction in several organs (spleen, aorta, liver, lung) near the time of LPS-induced symptom onset. Aorta, liver, and lung gene responses corresponded with both LPS-induced symptom onset patterns and plasma cytokine/chemokine levels. Parenchymal cells in aorta, liver, and lung bearing TLR4 responded to LPS with chemokine generation and were associated with increased plasma chemokine levels. We propose that parenchymal cells direct SIRS in response to LPS.


Figures

Figure 1
Figure 1. Blood neutrophil responses at 30 minutes post-injection (a) and 4 hours post-injection (b) along with several organ MPO contents at 4 hours post-injection (c-e) for four groups of TLR4 transplant mice given LPS (black) or saline (white).
15 TLR4+/+, 15 Marrow TLR4−/−, 15 Parenchymal TLR4−/−, and 15 TLR4−/− mice were used for this experiment. Data represented as mean ± standard error. *: p < 0.05 versus TLR4−/− given LPS; †: p < 0.05 versus Parenchymal TLR4−/− given LPS; ‡: p < 0.05 versus Marrow TLR4−/− given LPS; §: p < 0.01 versus TLR4+/+ given LPS.
Figure 2
Figure 2. Plasma levels at 4 hours post-injection of a) TNF-α, b) IL1-β, c) IL6, d) IL2, e) IL12, f) IFN-γ, g) IL5, h) IL4, i) CCL2, j) CXCL11, k) CCL3, and l) CXCL10 for four groups of TLR4 transplant mice given LPS (black) or saline (white).
15 TLR4+/+, 15 Marrow TLR4−/−, 15 Parenchymal TLR4−/−, and 15 TLR4−/− mice were used for this experiment. Data represented as mean ± standard error. Dotted line indicates minimal detectable threshold for assay. *: p < 0.01 versus TLR4−/− given LPS; †: p < 0.01 versus Parenchymal TLR4−/− given LPS; ‡: p < 0.01 versus Marrow TLR4−/− given LPS.
Figure 3
Figure 3. Tlr4 gene expression levels at 4 hours post-injection in a) spleen, b) aorta, c) liver, and d) lung for four groups of TLR4 transplant mice given LPS (black) or saline (white).
15 TLR4+/+, 15 Marrow TLR4−/−, 15 Parenchymal TLR4−/−, and 15 TLR4−/− mice were used for this experiment. Data represented as expression level (mean ± standard error) relative to TLR4+/+ mice given saline. Dotted line depicts relative gene expression level of one. *: p < 0.001 versus TLR4−/− given LPS; †: p < 0.001 versus TLR4−/− given PBS.
Figure 4
Figure 4. EGFP reporter gene expression levels at 4 hours post-injection in a) spleen, b) aorta, c) liver, and d) lung for four groups of TLR4 transplant mice given LPS (black) or saline (white).
15 TLR4+/+, 15 Marrow TLR4−/−, 15 Parenchymal TLR4−/−, and 15 TLR4−/− mice were used for this experiment. Data represented as expression level (mean ± standard error) relative to TLR4−/− mice given LPS. Dotted line depicts relative gene expression level of one. *: p < 0.001 versus TLR4−/− given LPS; †: p < 0.05 versus TLR4−/− given LPS.
Figure 5
Figure 5. Tnf-α gene expression levels at 4 hours post-injection in a) spleen, b) aorta, c) liver, and d) lung for four groups of TLR4 transplant mice given LPS (black) or saline (white).
15 TLR4+/+, 15 Marrow TLR4−/−, 15 Parenchymal TLR4−/−, and 15 TLR4−/− mice were used for this experiment. Data represented as expression level (mean ± standard error) relative to TLR4−/− mice given LPS. Dotted line depicts relative gene expression level of one. *: p < 0.001 versus TLR4−/− given LPS; †: p < 0.05 versus TLR4−/− given LPS.
Figure 6
Figure 6. Il6 gene expression levels at 4 hours post-injection in a) spleen, b) aorta, c) liver, and d) lung for four groups of TLR4 transplant mice given LPS (black) or saline (white).
15 TLR4+/+, 15 Marrow TLR4−/−, 15 Parenchymal TLR4−/−, and 15 TLR4−/− mice were used for this experiment. Data represented as expression level (mean ± standard error) relative to Parenchymal TLR4−/− mice given LPS (spleen) or TLR4−/− mice given LPS (aorta, liver, lung). Dotted line depicts relative gene expression level of one. *: p < 0.001 versus TLR4−/− given LPS; †: p < 0.05 versus TLR4−/− given LPS.
Figure 7
Figure 7. Ccl2 gene expression levels at 4 hours post-injection in a) spleen, b) aorta, c) liver, and d) lung for four groups of TLR4 transplant mice given LPS (black) or saline (white).
15 TLR4+/+, 15 Marrow TLR4−/−, 15 Parenchymal TLR4−/−, and 15 TLR4−/− mice were used for this experiment. Data represented as expression level (mean ± standard error) relative to TLR4−/− mice given LPS. Dotted line depicts relative gene expression level of one. *: p < 0.001 versus TLR4−/− given LPS; †: p < 0.05 versus TLR4−/− given LPS.

Similar articles

Cited by

References

    1. Bhatia M. Acute pancreatitis as a model of SIRS. Front Biosci 14, 2042–2050 (2009). - PubMed
    1. Bhatia M., He M., Zhang H. & Moochhala S. Sepsis as a model of SIRS. Front Biosci 14, 4703–4711 (2009). - PubMed
    1. Dahiya P. Burns as a model of SIRS. Front Biosci 14, 4962–4967 (2009). - PubMed
    1. Robertson C. M. & Coopersmith C. M. The systemic inflammatory response syndrome. Microbes Infect 8, 1382–1389, 10.1016/j.micinf.2005.12.016 (2006). - PubMed
    1. Thomas L. The physiological disturbances produced by endotoxins. Annu Rev Physiol 16, 467–490, 10.1146/annurev.ph.16.030154.002343 (1954). - PubMed

Publication types

MeSH terms