. 2012:2:919.
doi: 10.1038/srep00919. Epub 2012 Dec 4.

The importance of serine 776 in Ataxin-1 partner selection: a FRET analysis

Affiliations

The importance of serine 776 in Ataxin-1 partner selection: a FRET analysis

Rajesh P Menon et al. Sci Rep. 2012.

Abstract

Anomalous expansion of a polymorphic tract in Ataxin-1 causes the autosomal dominant spinocerebellar ataxia type 1. In addition to polyglutamine expansion, requirements for development of pathology are phosphorylation of serine 776 in Ataxin-1 and nuclear localization of the protein. The phosphorylation state of serine 776 is also crucial for selection of the Ataxin-1 multiple partners. Here, we have used FRET for an in cell study of the interaction of Ataxin-1 with the spliceosome-associated U2AF65 and the adaptor 14-3-3 proteins. Using wild-type Ataxin-1 and Ser776 mutants to a phosphomimetic aspartate and to alanine, we show that U2AF65 binds Ataxin-1 in a Ser776 phosphorylation independent manner whereas 14-3-3 interacts with phosphorylated wild-type Ataxin-1 but not with the mutants. These results indicate that Ser776 acts as the molecular switch that discriminates between normal and aberrant function and that phosphomimetics is not a generally valid approach whose applicability should be carefully validated.


Figures

Figure 1
Figure 1. Schematic representation of wild-type (Wt) Atx1 and the Atx1, 14-3-3 and U2AF65 constructs used in this study.
The positions of the polyQ tract, the AXH domain and serine 776 are indicated on Atx1 as are the positions of the CFP and YFP tags on the proteins. NLS- Nuclear Localisation Signal.
Figure 2
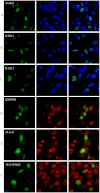
Figure 2. Expression of CFP and YFP tagged proteins in COS cells.
Left panels show the expression of indicated fusion proteins. Middle panels show nucleus stained with either DAPI (A,B,C) or Propidium Iodide (D,E,F). Right panels show merged images.
Figure 3
Figure 3. ‘Rainbow’ look-up table (LUT)-encoded pseudocolour pre- and postbleach images of CFP-U2AF65 (A,D,G) and YFP-Atx1 (B,E,H: S-Atx1-YFP, A-Atx1-YFP and D-Atx1-YFP, respectively).
Magnified crops of both CFP and YFP signals in the bleach region (black circles) are depicted for pre- and post-bleach for each FRET pair (C,F,I). All scale bars are 5 μm.
Figure 4
Figure 4. ‘Rainbow’ pseudocolour look-up table (LUT)-encoded pre- and postbleach images of CFP-14-3-3-NLS (A,D,G) and YFP-Atx1 (B,E,H: S-Atx1-YFP, A-Atx1- YFP and D-Atx1-YFP, respectively).
Magnified crops of both CFP and YFP signals in the bleach region (black circles) are depicted for pre- and post-bleach for each FRET pair (C,F,I). All scale bars are 5 μm.
Figure 5
Figure 5. Box and whisker plots depicting population distribution of percentage corrected FRET and showing maximum, minimum, upper & lower quartiles, and sample median.
Bleach regions tested were inside nuclear foci (foci, f) and outside nuclear foci (non-foci, n). (A) CFP-U2AF65 Vs YFP-Ataxin-1 (wild-type, Alanine, and Aspartic acid substitution mutants). B) CFP-Wt-14-3-3 (orange) and CFP-14-3-3- NLS (blue) Vs YFP-Ataxin-1 (wild-type, Alanine, and Aspartic acid substitution mutants). Means +/− standard errors, rounded to one decimal place, are shown above each boxplot. Statistical significance bars are shown and represent results of unpaired t-tests of mean difference = 0 (* = P<0.05,** = P<0.01, *** = P<0.001). N numbers (left to right) are: (A) N = 16, N = 10, N = 24, N = 22, N = 21, N = 21; (B) N = 15, N = 12, N = 22, N = 26, N = 22, N = 14, N = 19, N = 15; and represent number of individual bleach events pooled from at least 4 individual cells.
Figure 6
Figure 6. Structural determinants of the interaction between 14-3-3 andphosphopeptides.
A model of the complex of Atx1 with 14-3-3 was built using the accession name 1qjb as a template by replacing the Atx1 residues using phosphorylated serine (left) or an aspartate (right). The backbone of 14-3-3 is shown as green ribbons. The side chains of residues that surround the peptide are explicitly shown in yellow. The peptide is shown in green. The position of the phospho-serine or aspartate is indicated with a red circle. The substitution leads to a different geometry and to longer distances between the charged groups.

Similar articles

Cited by

References

    1. Orr H. T., Chung M. Y., Banfi S., Kwiatkowski T. J. Jr., Servadio A., Beaudet A. L., McCall A. E., Duvick L. A., Ranum L. P. & Zoghbi H. Y. Expansion of an unstable trinucleotide CAG repeat in spinocerebellar ataxia type 1. Nat. Genet. 4, 221–226 (1993). - PubMed
    1. Zoghbi H. Y. & Orr H. T. Spinocerebellar ataxia type 1. Semin. Cell Biol. 6, 29–35 (1995). - PubMed
    1. Cummings C. J., Orr H. T. & Zoghbi H. Y. Progress in pathogenesis studies of spinocerebellar ataxia type 1. Philos. Trans. R Soc. Lond. B Biol. Sci. 354, 1079–1081 (1999). - PMC - PubMed
    1. Matilla-Dueñas A., Goold R. & Giunti P. Clinical, genetic, molecular, and pathophysiological insights into spinocerebellar ataxia type 1. Cerebellum 7, 106–114 (2008). - PubMed
    1. Cummings C. J., Mancini M. A., Antalffy B., DeFranco D. B., Orr H. T. & Zoghbi H. Y. Chaperone suppression of aggregation and altered subcellular proteasome localization imply protein misfolding in SCA1. Nat. Genet. 19, 148–154 (1998). - PubMed

Publication types

MeSH terms

LinkOut - more resources