. 2012 Jan 15;1(1):12-8.
doi: 10.1242/bio.2011012. Epub 2011 Oct 24.

Dual pathway spindle assembly increases both the speed and the fidelity of mitosis

Affiliations

Dual pathway spindle assembly increases both the speed and the fidelity of mitosis

Kuniyoshi Kaseda et al. Biol Open. .

Abstract

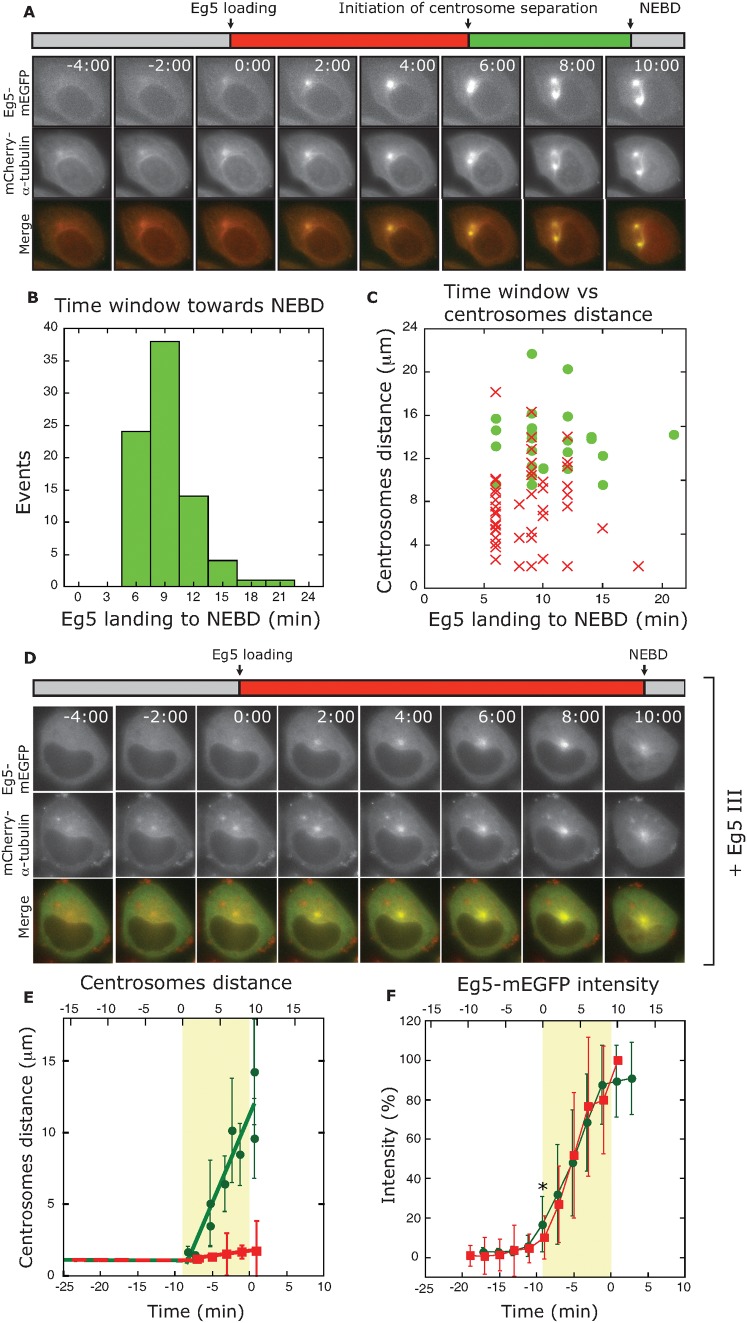
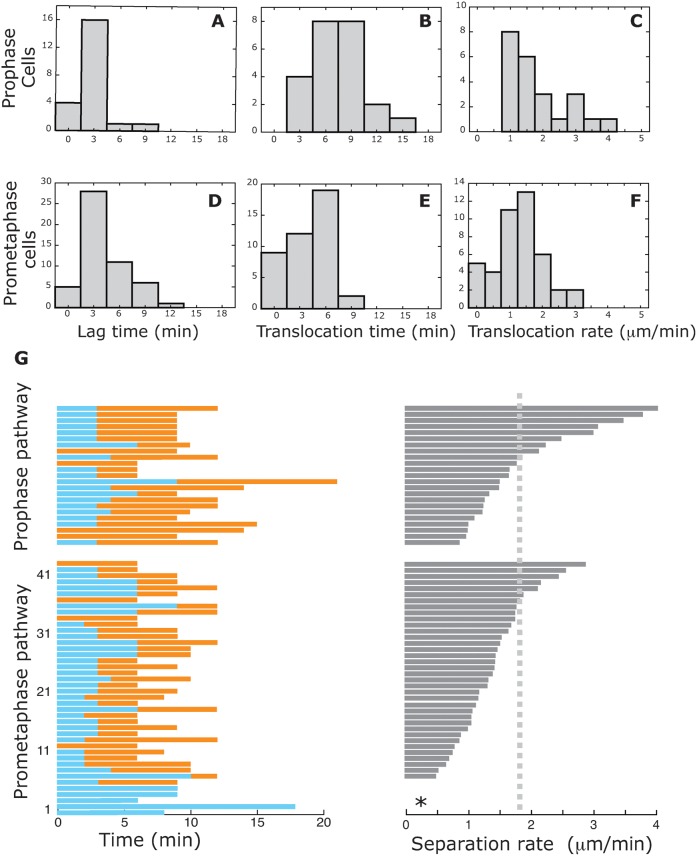
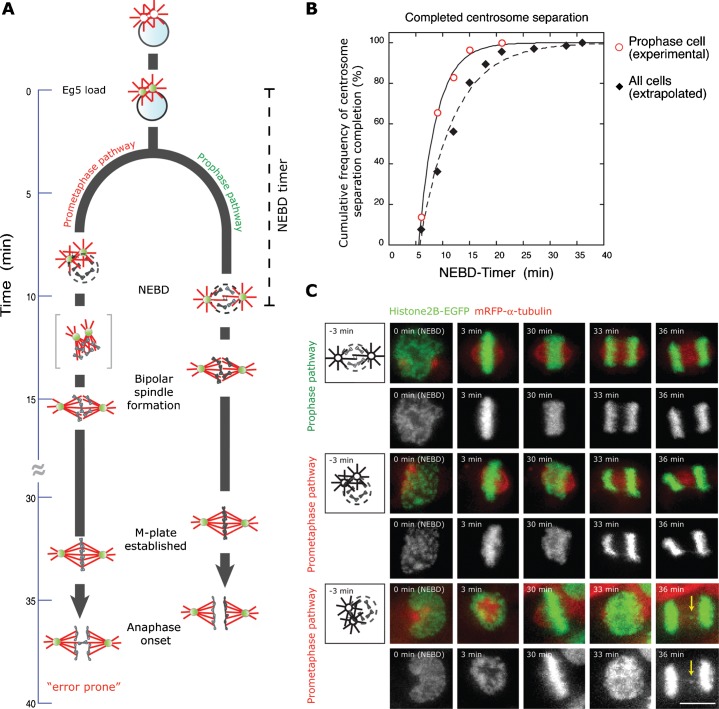
Roughly half of all animal somatic cell spindles assemble by the classical prophase pathway, in which the centrosomes separate ahead of nuclear envelope breakdown (NEBD). The remainder assemble by the prometaphase pathway, in which the centrosomes separate following NEBD. Why cells use dual pathway spindle assembly is unclear. Here, by examining the timing of NEBD relative to the onset of Eg5-mEGFP loading to centrosomes, we show that a time window of 9.2 ± 2.9 min is available for Eg5-driven prophase centrosome separation ahead of NEBD, and that those cells that succeed in separating their centrosomes within this window subsequently show >3-fold fewer chromosome segregation errors and a somewhat faster mitosis. A longer time window would allow more cells to complete prophase centrosome separation and further reduce segregation errors, but at the expense of a slower mitosis. Our data reveal dual pathway mitosis in a new light, as a substantive strategy that increases both the speed and the fidelity of mitosis.


Conflict of interest statement

Competing Interests: The authors declare no competing interests.

Figures

Fig. 1.
Fig. 1.. Eg5 loading to centrosomes indexes the mitotic clock.
(A) Successive views of an mCherry-α-tubulin HeLa cell, transiently expressing Eg5-mEGFP. Images were acquired every 2 min. T=0 is assigned as the first frame in which Eg5 loading becomes detectable. Internal consistency was checked by averaging all sequences, and showed that the corresponding frame in the averaged time-course was the first frame in which the Eg5-mEGFP signal was statistically significantly (P’<0.01) brighter than that in the preceding frame (asterisks in Figure 1A & 1F). Lag time is that between T=0 and initiation of centrosome separation. Translocation time is that between initiation of centrosome separation and NEBD. NEBD, the moment of nuclear envelope breakdown (NEBD), delineating the end of prophase, is defined as the first frame in which mCherry-α−tubulin fluorescence is apparent inside the nuclear volume. This cell used the prometaphase pathway; see supplementary video 2. (B) Time window between the onset of Eg5-loading and NEBD. The mean is 9.2±2.9 min (n=82). (C)’Time window duration and centrosomes interdistance are uncorrelated in both the prophase (filled circles) and prometaphase (open circles) pathways, showing that an NEBD countdown timer operates independently of centrosome separation distance. (D) Eg5 loading to centrosomes in the presence of an Eg5-specific small molecule inhibitor (1 µM EI III; conditions as in (A)); see supplementary video 3. Centrosome separation is blocked. (E) Centrosome separation distance versus time in the absence (filled circles) and in the presence (open squares) of EI III. (F) Normalised Eg5-mEGFP intensity on the centrosomes in the absence (filled circles) and presence (open squares) of EI III. All values are shown as mean ± SD. The time window for prophase centrosome separation (yellow boxes) operates identically in the presence of absence of EI III.
Fig. 2.
Fig. 2.. Centrosome movement in the prophase and prometaphase pathways.
Lag time (A and D), translocation time (B and E) and centrosome separation rate (C and F) for prophase (A to C) and prometaphase pathways (D to F). Centrosome separation rate was measured only whilst the two centrosomes were moving within the optical plane corresponding to the underside of the nucleus. In the prophase pathway, the mean lag time, translocation time and separation rate are 3.0±2.0 min SD (n=22), 7.4±3.0 min (n=22) and, 1.8±0.9 µm/min (n=23), respectively. In the prometaphase pathway, these parameters are 4.1±2.8 min (n=51), 4.1±2.6 min (n=42) and 1.3±0.7 µm/min (n=43). (G) Individual cell histories for prophase pathway (above) and prometaphase pathway (below) cells. Each horizontal bar represents one cell. Lag time (cyan bar), translocation time (orange bar) and centrosome separation rate (grey bar) are plotted for each cell. The records are shown sorted in order of separation rate. The dotted line shows the average velocity (1.8 µm/min) of prophase pathway cells. Data are mean ± SD.
Fig. 3.
Fig. 3.. Eg5 localizes to anti-parallel microtubules that bridge between the two centrosomes in early prophase.
(A to C) Time course of centrosome separation in an mCherry-α-tubulin HeLa cell transiently transfected with mEGFP-Eg5. Images shown are 30s apart. (A) Eg5-mEGFP, (B) mCherry-α–tubulin and (C) merge. The cell used the prophase pathway. (D) Enlarged views of Eg5-mEGFP and mCherry-α–tubulin at 0:30 min; see supplementary video 4. (E and F) Representative images of HeLa cells in early prophase, fixed and stained with anti-Eg5 antibodies, anti-α –tubulin and DAPI.
Fig. 4.
Fig. 4.. (A) Schematic of dual-pathway mitosis. The onset of Eg5 loading marks the opening, and NEBD the closure, of a ∼9 minute time window.
Prophase pathway cells succeed in completing centrosome separation within this window; prometaphase pathway cells do not. Prophase pathway cells achieve bipolar spindle formation 3-4 minutes faster than prometaphase pathway cells because they avoid the need to resolve a transient monopolar state (brackets). Prophase pathway cells make at least 3-fold fewer segregation errors than prometaphase pathway cells (B) Cumulative completion of centrosome separation. Open symbols: prophase pathway cells. Centrosome separation completes exponentially, with a rate constant of 0.30 ± 0.02 min−1. Filled symbols: all cells. Centrosome separation completes exponentially with a rate constant of 0.16 ± 0.01 min−1. Data at later time points were calculated by extrapolating a time for completion of centrosome separation based on the measured velocity of centrosome separation prior to NEBD (see Methods). A longer time window would allow more cells to complete prophase centrosome separation, and further reduce segregation errors, but would delay mitosis. A shorter window would drive all cells through the prometaphase pathway, producing more errors. (C) Successive frames from live-cell movies of HeLa cells expressing Histone2B–EGFP/mRFP-α-tubulin that follow either the prophase pathway or prometaphase pathway. Schematic in first column indicates the position of centrosomes at the time point before nuclear envelope breakdown (−3 min). Yellow arrows indicate a lagging chromosome in a prometaphase pathway cell (bottom two rows). Scale bar is 10 µm.

References

    1. Bakhoum S. F., Genovese G., Compton D. A. (2009). Deviant kinetochore microtubule dynamics underlie chromosomal instability. Curr Biol. 19, 1937–1942 10.1016/j.cub.2009.09.055 - DOI - PMC - PubMed
    1. Basto R., Lau J., Vinogradova T., Gardiol A., Woods C. G., Khodjakov A., Raff J. W. (2006). Flies without centrioles. Cell. 125, 1375–1386 10.1016/j.cell.2006.05.025 - DOI - PubMed
    1. Blangy A., Lane H. A., d'Herin P., Harper M., Kress M., Nigg E. A. (1995). Phosphorylation by p34cdc2 regulates spindle association of human Eg5, a kinesin-related motor essential for bipolar spindle formation in vivo. Cell. 83, 1159–1169 10.1016/0092-8674(95)90142-6 - DOI - PubMed
    1. Caudron M., Bunt G., Bastiaens P., Karsenti E. (2005). Spatial coordination of spindle assembly by chromosome-mediated signaling gradients. Science. 309, 1373–1376 10.1126/science.1115964 - DOI - PubMed
    1. Cochran J. C., Gatial J. E., 3rd, Kapoor T. M., Gilbert S. P. (2005). Monastrol inhibition of the mitotic kinesin Eg5. J Biol Chem. 280, 12658–12667 10.1074/jbc.M413140200 - DOI - PMC - PubMed