. 2012 Aug 15;1(8):815-25.
doi: 10.1242/bio.20121081. Epub 2012 Jun 29.

Proteomic analysis of multiple primary cilia reveals a novel mode of ciliary development in mammals

Affiliations

Proteomic analysis of multiple primary cilia reveals a novel mode of ciliary development in mammals

Keishi Narita et al. Biol Open. .

Abstract

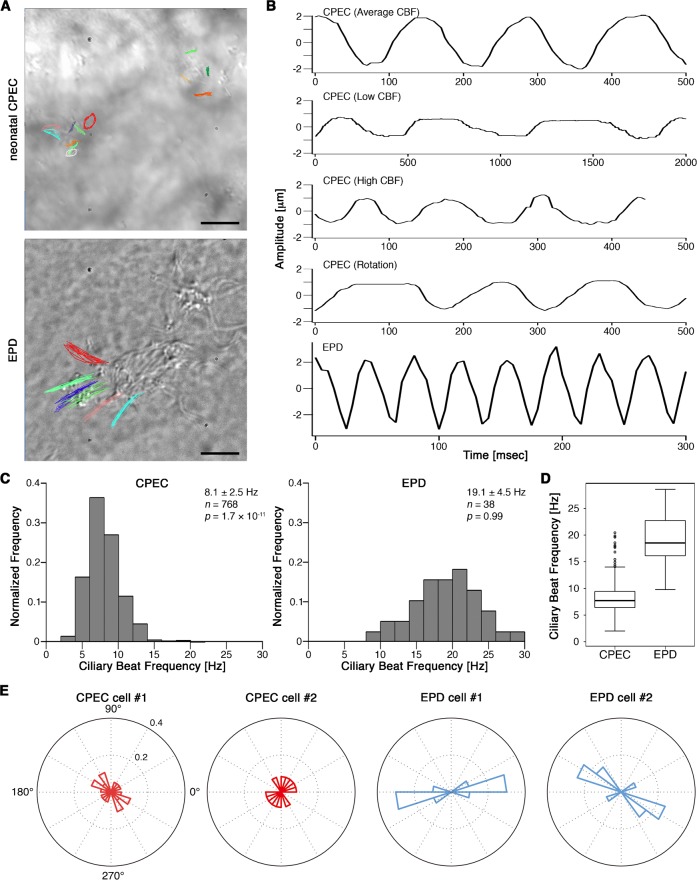
Cilia are structurally and functionally diverse organelles, whose malfunction leads to ciliopathies. While recent studies have uncovered common ciliary transport mechanisms, limited information is available on the proteome of cilia, particularly that of sensory subtypes, which could provide insight into their functional and developmental diversities. In the present study, we performed proteomic analysis of unique, multiple 9+0 cilia in choroid plexus epithelial cells (CPECs). The analysis of juvenile swine CPEC cilia identified 868 proteins. Among them, 396 were shared with the proteome of 9+0 photoreceptor cilia (outer segment), whereas only 152 were shared with the proteome of 9+2 cilia and flagella. Various signaling molecules were enriched in a CPEC-specific ciliome subset, implicating multiplicity of sensory functions. The ciliome also included molecules for ciliary motility such as Rsph9. In CPECs from juvenile swine or adult mouse, Rsph9 was localized to a subpopulation of cilia, whereas they were non-motile. Live imaging of mouse choroid plexus revealed that neonatal CPEC cilia could beat vigorously, and the motility waned and was lost within 1-2 weeks. The beating characteristics of neonatal CPEC cilia were variable and different from those of typical 9+2 cilia of ependyma, yet an Efhc1-mediated mechanism to regulate the beating frequency was shared in both types of cilia. Notably, ultrastructural analysis revealed the presence of not only 9+0 but also 9+2 and atypical ciliary subtypes in neonatal CPEC. Overall, these results identified both conserved and variable components of sensory cilia, and demonstrated a novel mode of ciliary development in mammals.

Keywords: Cilia; Development; Proteomics.


Conflict of interest statement

Competing Interests: The authors declare that there are no competing interests.

Figures

Fig. 1.
Fig. 1.. Proteomic analysis of swine choroid plexus epithelial cilia.
(A) Swine CPEC cilia detached by dibucaine hydrochloride. Crude cilia in suspension were ultracentrifuged, and the resulting pellet was fixed and immunostained for acetylated alpha tubulin (Green). Bar, 20 µm. For proteomic analysis, detached cilia were enriched further by differential centrifugation followed by equilibrium sedimentation. (B) Analysis of CPEC cilia proteomics data using the Ciliome database. A database search of molecules identified in the present study was performed. If molecules were already listed, the types of cilia the data were derived from were determined; 9+0, proteome of mouse photoreceptor sensory cilia (Liu et al., 2007); 9+2, proteome of motile cilia and flagella from human bronchial epithelium (Ostrowski et al., 2002), Chlamydomonas (Pazour et al., 2005), and trypanosome (Broadhead et al., 2006); Global, datasets were obtained by comparative genomics (Avidor-Reiss et al., 2004; Li et al., 2004), transcriptional profiling of Chlamydomonas (Stolc et al., 2005), and analysis of genes containing an x-box in C. elegans (Blacque et al., 2005; Efimenko et al., 2005); Centrosome, proteome of centrosome from human lymphoblastoma (Andersen et al., 2003) and Chlamydomonas (Keller et al., 2005). The actual counts of molecules in each category are shown in the key. (C) Gene ontology terms enriched in the CPEC ciliome. The dataset of 868 CPEC ciliome was analyzed using the DAVID server. Shown in this panel are those with more than 40 gene counts, P<0.01, and more than 2-fold enrichment values.
Fig. 2.
Fig. 2.. Validation of motile cilium component gene expression in choroid plexus epithelium.
(A) Primary cultures of mouse ependyma (EPD; left), choroid plexus epithelium (CPEC, middle) and serum-starved NIH3T3 cells (right). Cells were immunostained for acetylated alpha tubulin (Green). Cell nuclei were counter-stained with DAPI (Blue). Bar, 16 µm. (B) Real-time PCR analysis. The gene expression levels of motile cilium components (Dpcd, Rsph4a and Rsph9) identified by the CPEC ciliome were assessed by the comparative CT method. RNA samples from EPD and CPEC were prepared from mouse primary cultures, and their qualities were validated by the expression levels of CD24a (EPD marker) and transthyretin (TTR; CPEC marker). The −ΔΔCT values were calculated using B2m as an endogenous reference and CPEC as a calibrator. For CD24a, EPD was used as a calibrator. Values were expressed as the mean ± s.d. *, P<0.5; **, P<0.01; ***, P<0.001 versus calibrator.
Fig. 3.
Fig. 3.. Immunological analysis of Rsph9.
(A) Western blot analysis for Rsph9. Whole cell lysates from mouse sperm and ependymal cell cultures (10 µg of total protein each) were used for the analysis, yielding an immunoreactive band of ∼31 kDa. The positions and sizes (kDa) of the molecular weight standard are indicated on the left. (B) Top, comparison of Rsph9 protein levels between ependyma (EPD), choroid plexus epithelium (CPEC), and NIH3T3 cells. The immunoblot for actin shows equal loading. Bottom, quantification of Rsph9 protein levels by image analysis (n = 4). (C) Immunostaining of adult mouse brain sections for acetylated alpha tubulin (Green) and Rsph9 (Red). The panels shown are the ependymal layer (top) and choroid plexus (bottom). Bars, 5 µm. (D) Immunostaining of swine choroid plexus tissue (top) and purified swine choroid plexus cilia (bottom) for acetylated alpha tubulin (Green) and Rsph9 (Red). For the top panel, cell nuclei were counter-stained with DAPI (Blue). Arrowheads indicate Rsph9-positive cilia. Note the uneven distribution of Rsph9, suggesting the heterogeneity of CPEC primary cilia in terms of motility. Bars, 20 µm. (E) Quantification of Rsph9-positive cilia by image analysis of purified swine choroid plexus cilia shown in D.
Fig. 4.
Fig. 4.. Characterization of newborn CPEC ciliary motility.
(A) Top view snapshots of neonatal mouse CPEC (top) and differentiated ependymal cultures (bottom) observed by high-speed video microscopy. The tips of individual cilia were traced manually. Note the presence of both beating and rotating cilia, small beating amplitude and random beating orientation in CPECs. The original live imaging data are available in supplementary material Movie 2. Bars, 5 µm. (B) Representative plots of CPECs and ependymal ciliary tip movements. For each ciliary tip tracing, the long axis was determined and defined as the Y-axis of the plot. (C,D) Summary histograms (C) and box-and-whisker plots (D) of ciliary beating frequency showing differences between neonatal CPECs and differentiated ependymal cultures. (E) Circular histograms showing the angular distribution of ciliary beating axes in single cells. The data were normalized to the number of tracked cilia, and each element of the histogram was drawn in point symmetry to the center of the graph.
Fig. 5.
Fig. 5.. Measurement of newborn Efhc1−/− CPEC ciliary beating frequency.
A summary histogram of ciliary beating frequency in CPECs from neonatal Efhc1 knockout mice, showing significantly lower beating frequency than wild-type (P = 1.3×10⁻⁸, Mann-Whitney test).
Fig. 6.
Fig. 6.. Ultrastructural analysis of neonatal mouse CPEC cilia.
Representative longitudinal (A) and transverse (B) sections of neonatal mouse CPEC cilia. In (A), the basal body and ciliary axoneme were highlighted with black and white arrowheads, respectively. The ciliary axonemes shown in (B) all took 9+0 configuration. Bars, 500 nm. (C) Summary of the ultrastructural analysis of neonatal mouse CPEC cilia. The axonemal structures of 74 cilia were investigated and classified into three categories. Bar, 100 nm. (D) A representative transverse section of juvenile swine CPEC cilia, which all took 9+0 and the derived configurations. Due to an unavoidable delay in fixing the swine tissue at slaughterhouse, the membrane structure was damaged. Bar, 500 nm. Inlay, magnified view. Bar, 100 nm.

References

    1. Adams M., Simms R. J., Abdelhamed Z., Dawe H. R., Szymanska K., Logan C. V., Wheway G., Pitt E., Gull K., Knowles M. A. et al. (2012). A meckelin-filamin A interaction mediates ciliogenesis. Hum. Mol. Genet. 21, 1272–1286 10.1093/hmg/ddr557 - DOI - PMC - PubMed
    1. Andersen J. S., Wilkinson C. J., Mayor T., Mortensen P., Nigg E. A., Mann M. (2003). Proteomic characterization of the human centrosome by protein correlation profiling. Nature 426, 570–574 10.1038/nature02166 - DOI - PubMed
    1. Avidor-Reiss T., Maer A. M., Koundakjian E., Polyanovsky A., Keil T., Subramaniam S., Zuker C. S. (2004). Decoding cilia function: defining specialized genes required for compartmentalized cilia biogenesis. Cell 117, 527–539 10.1016/S0092-8674(04)00412-X - DOI - PubMed
    1. Beisson J., Wright M. (2003). Basal body/centriole assembly and continuity. Curr. Opin. Cell Biol. 15, 96–104 10.1016/S0955-0674(02)00017-0 - DOI - PubMed
    1. Blacque O. E., Perens E. A., Boroevich K. A., Inglis P. N., Li C., Warner A., Khattra J., Holt R. A., Ou G., Mah A. K. et al. (2005). Functional genomics of the cilium, a sensory organelle. Curr. Biol. 15, 935–941 10.1016/j.cub.2005.04.059 - DOI - PubMed