. 2012 Sep 15;1(9):839-47.
doi: 10.1242/bio.20121222. Epub 2012 Jul 9.

Sca-1 is involved in the adhesion of myosphere cells to αVβ3 integrin

Affiliations

Sca-1 is involved in the adhesion of myosphere cells to αVβ3 integrin

Ashley Penvose et al. Biol Open. .

Abstract

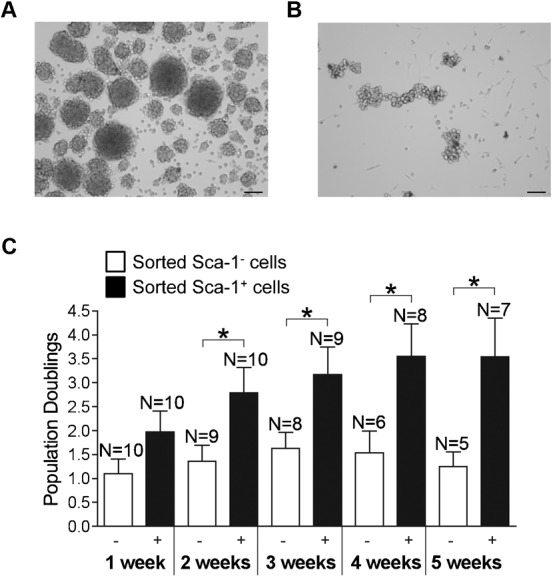
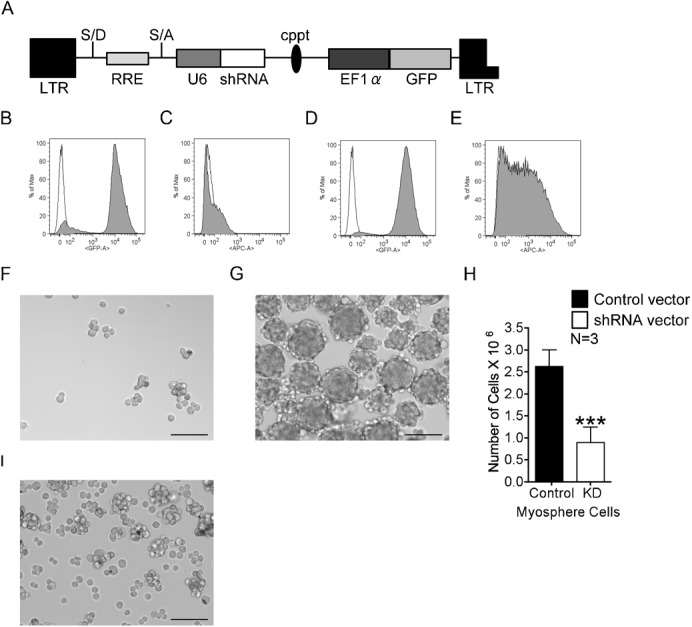
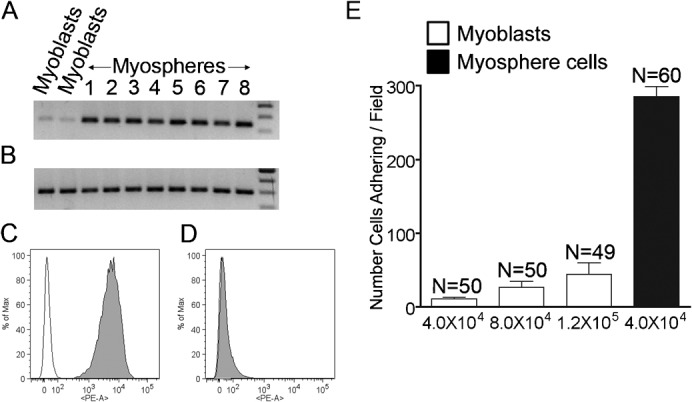
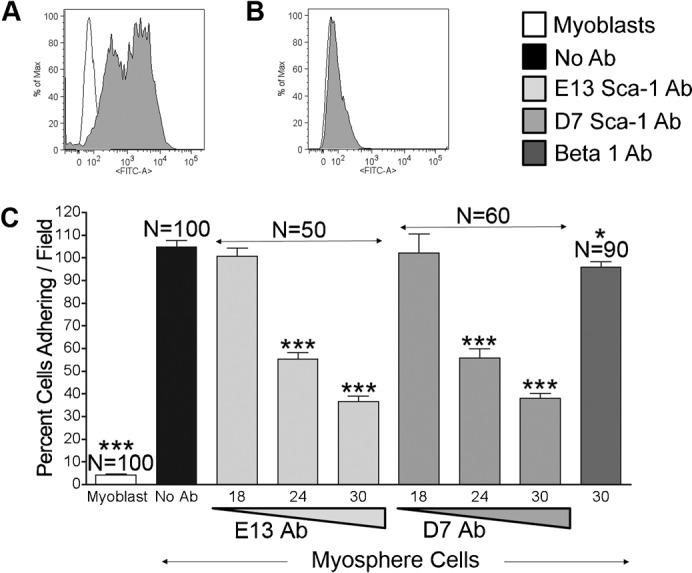
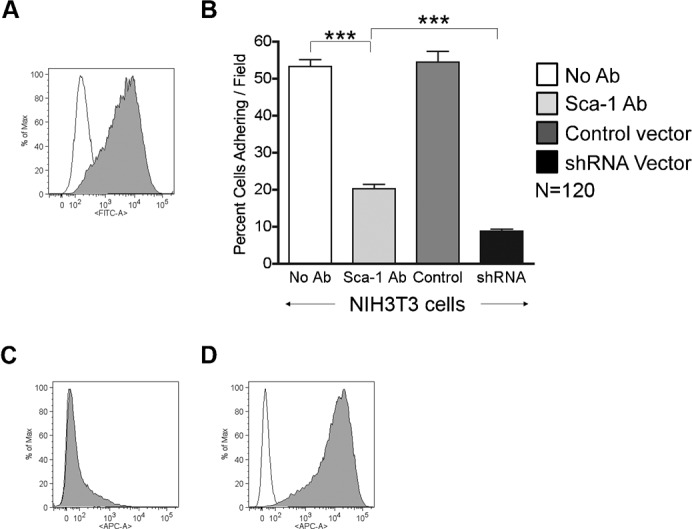
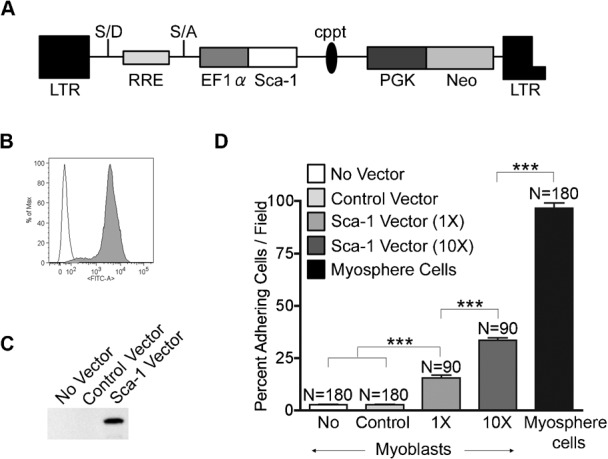
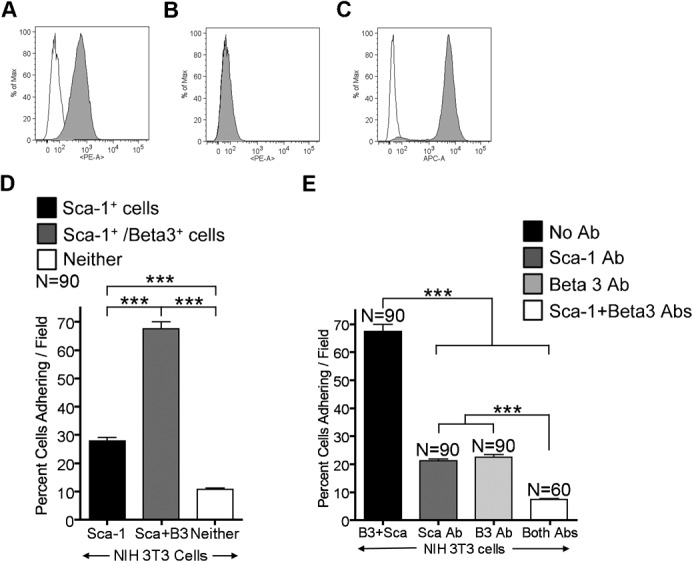
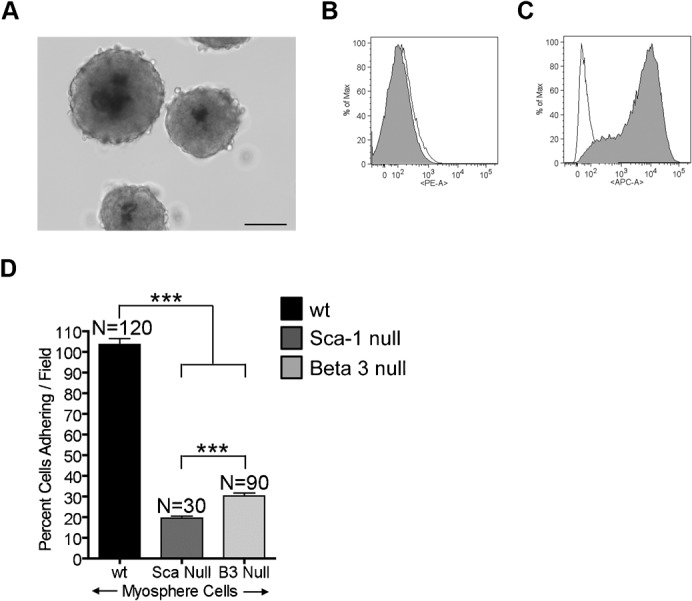
A myosphere cell is a unique type of muscle stem cell that is able to maintain its pre-myogenic state in culture over time. These cells are propagated in culture as free-floating, non-adherent spheres. We believe that the 3-dimensional adhesive cell-cell interactions involved in maintaining the sphere-like myosphere structures are also involved in maintaining their longevity in culture. We found that Sca-1, which is highly expressed by myosphere cells, plays a role in the growth and the formation of the myospheres. In comparing adhesion molecules expressed by 3-dimensionally grown myosphere cells to those expressed by 2-dimensionally grown primary myoblasts, we found that there was a distinct difference in the expression of β3 integrin. Upon further investigation we discovered that there is an adhesive interaction between Sca-1(+) cells and αVβ3 integrin. Here we show that Sca-1(+) cells (myosphere cells and NIH3T3 cells) adhere to αVβ3 integrin and that Sca-1(-) cells (primary myoblasts) do not adhere. The interaction between Sca-1 and αVβ3 integrin was confirmed using antibody blocking, shRNA knockdown of Sca-1 in Sca-1(+) cells, and by expressing Sca-1 cDNA in Sca-1(-) cells, which demonstrated that the level of adhesion of these cells to αVβ3 integrin was dependent on the presence of Sca-1. Additionally, we found that the co-expression of Sca-1 and β3 resulted in significantly greater adhesion of Sca-1(+) cells to αVβ3 integrin. In conclusion, our data indicate that Sca-1 is involved in maintaining the 3-dimensional myosphere cell-cell contacts and that Sca-1 is involved in the binding of cells to αVβ3 integrin.

Keywords: Muscle stem cells; Myosphere; Sca-1; αVβ3 integrin.


Conflict of interest statement

Competing interests: The authors have no competing interests to declare.

Figures

Fig. 1.
Fig. 1.. Myosphere formation and Population doublings.
Myospheres generated by sorted (A) Sca-1+ and (B) Sca-1 cells. (C) Population doublings for Sca-1 and Sca-1+ sorted cell populations are shown over the course of 5 weeks. Sca-1 sorted cells are represented in white and Sca-1+ in black. These results were pooled from ten independent sorts. Error bars display ± s.e.m. *P<0.04 by unpaired Student's t test. Measure bars shown in A,B represent 100 µm.
Fig. 2.
Fig. 2.. shRNA knockdown of Sca-1.
(A) Bicistronic shRNA lentiviral vector used to transduce myosphere cells. FACS profiles showing the expression of GFP and Sca-1, respectively, in myosphere cells transduced by the (B,C) shRNA Sca-1 knockdown vector and (D,E) control shRNA vector. Empty peaks represent the unstained control; filled peaks represent GFP expression and cells incubated with APC conjugated Sca-1 antibody, respectively. Myospheres generated from cells transduced with the (F) Sca-1 shRNA knockdown vector and (G) shRNA control vector. (H) Graph showing the number of myosphere cells nine days after transduction with either the control shRNA vector (black) or the shRNA Sca-1 knockdown vector (white). Error bars display ± s.e.m. ***P<0.0001 by unpaired Student's t test. (I) Myospheres isolated from Sca-1 null mice. Measure bars shown in F,G,I represent 100 µm.
Fig. 3.
Fig. 3.. Myosphere cells adhere to αVβ3 integrin.
Reverse transcription PCR showing the expression of (A) β3 integrin and (B) β1 integrin in myoblasts and myosphere cells. Representative FACS profiles showing β3 integrin expression by (C) myosphere cells and (D) myoblasts. Empty peaks represent the unstained controls, filled peaks cells incubated with PE conjugated β3 integrin antibody. (E) Graph showing the number of cells adhering/field to αVβ3 integrin versus cells tested, myoblasts are shown in white and myosphere cells in black. These results were pooled from two independent experiments. Error bars display ± s.e.m.
Fig. 4.
Fig. 4.. Sca-1 antibodies block adhesion to αVβ3 integrin.
Representative FACS profiles showing Sca-1 expression by (A) myosphere cells and (B) myoblasts. Empty peaks represent unstained controls, filled peaks cells incubated with FITC conjugated Sca-1 antibody. (C) Graph showing percent of cells adhering/field to αVβ3 integrin versus cells incubated with antibody, represented are myoblasts (white), myosphere cells incubated with: no antibody (black), Sca-1 E13 antibody (light gray), Sca-1 D7 antibody (medium gray), and β1 integrin antibody (dark gray). Each of the Sca-1 antibody results was pooled from two independent experiments; the β1 antibody results were pooled from three independent experiments. Error bars display ± s.e.m. *Indicates P = 0.029, ***Indicates P<0.0001 both by unpaired Student's t test.
Fig. 5.
Fig. 5.. NIH3T3 cells adhere to αVβ3 integrin.
(A) Representative FACS profile showing Sca-1 expression in NIH3T3 cells. Empty peak represents the unstained control; filled peak represents cells incubated with FITC conjugated Sca-1 antibody. (B) Graph showing the percent of cells adhering/field to αVβ3 integrin versus cells tested, represented are NIH3T3 cells with no antibody (white), Sca-1 antibody (light gray), transduced with control shRNA vector (dark gray), and transduced with shRNA Sca-1 knockdown vector (black). FACS profiles show Sca-1 expression in NIH3T3 cells transduced by the (C) shRNA Sca-1 knockdown vector and (D) control shRNA vector. Empty peaks represent the unstained control; filled peaks represent cells incubated with APC conjugated Sca-1 antibody. The results in this figure are pooled from 3 independent experiments. Error bars display ± s.e.m. ***P<0.0001 by unpaired Student's t test.
Fig. 6.
Fig. 6.. Sca-1 expression in myoblasts increases adhesion to αVβ3 integrin.
(A) Bicistronic lentiviral vector used to transduce primary myoblasts. (B) FACS profile showing Sca-1 expression by transduced myoblasts. Empty peak represents the unstained control, filled peak myoblasts incubated with FITC conjugated Sca-1 antibody. (C) Western showing the expression of Sca-1 in untransduced, control transduced, and Sca-1 transduced myoblasts. (D) Graph showing the percent of cells adhering/field to αVβ3 integrin versus cells tested, represented are myoblasts (white), myoblasts transduced by the control vector (light gray), myoblasts transduced by the Sca-1 vector (medium gray, MOI = 5) and (dark gray, MOI = 50), and myosphere cells (black). Results were pooled from 6 independent adhesion assays (3 for cell transduced at an MOI = 5, and 3 for those transduced at a MOI = 50). Error bars display ± s.e.m. ***P<0.0001 by unpaired Student's t test.
Fig. 7.
Fig. 7.. β3 integrin enhances the adhesion of Sca-1+ NIH3T3 cells.
Representative FACS profiles showing the expression of (A) αV integrin and (B) β3 integrin in NIH3T3 cells. Empty peaks represent the unstained control; filled peaks represent cells incubated with PE conjugated αV and β3 integrin antibodies. (C) FACS profile of NIH3T3 cells after transduction with the β3 integrin vector. Empty peak represents the unstained control; filled peak represents cells incubated with APC conjugated β3 integrin antibody. (D) Graph showing the percent of cells adhering/field to αVβ3 integrin versus cells tested, represented are NIH3T3 cells (black), NIH3T3 cells expressing β3 integrin (dark gray), NIH3T3 cells expressing neither Sca-1 or β3 integrin (white). (E) Graph showing the percent of cells adhering/field to αVβ3 integrin versus cells tested, represented are NIH3T3 cells expressing both Sca-1 and β3 integrin incubated with: no antibodies (black), Sca-1 antibody (dark gray), β3 integrin antibody (light gray), both Sca-1 and β3 integrin antibodies (white). The results in D,E were pooled from 3 independent experiments. Error bars display ± s.e.m. ***P<0.0001 by unpaired Student's t test.
Fig. 8.
Fig. 8.. Growth and adhesion of β3 null myospheres.
(A) Myospheres generated from β3 integrin null mice. FACS profiles showing the expression of (B) β3 integrin and (C) Sca-1 by β3 null myospheres. Empty peaks represent the unstained controls; filled peaks represents cells incubated with PE conjugated to β3 integrin antibody and APC conjugated to Sca-1 antibody, respectively. (D) Graph showing the percent of cells adhering/field to αVβ3 integrin versus cells tested; represented are myosphere cells isolated from wild type (black), Sca-1 null (dark gray), and β3 integrin null (light gray) mice. These results were pooled from 2 independent experiments. Error bars display ± s.e.m. ***P<0.0001 by unpaired Student's t test. Measure bar shown in A represents 100 µm.

Similar articles

Cited by

References

    1. Asakura A., Seale P., Girgis-Gabardo A., Rudnicki M. A. (2002). Myogenic specification of side population cells in skeletal muscle. J. Cell Biol. 159, 123–134 10.1083/jcb.200202092 - DOI - PMC - PubMed
    1. Barczyk M., Carracedo S., Gullberg D. (2010). Integrins. Cell Tissue Res. 339, 269–280 10.1007/s00441-009-0834-6 - DOI - PMC - PubMed
    1. Blaschuk K. L., Guérin C., Holland P. C. (1997). Myoblast αvβ3 integrin levels are controlled by transcriptional regulation of expression of the β3 subunit and down-regulation of β3 subunit expression is required for skeletal muscle cell differentiation. Dev. Biol. 184, 266–277 10.1006/dbio.1997.8527 - DOI - PubMed
    1. Bradfute S. B., Graubert T. A., Goodell M. A. (2005). Roles of Sca-1 in hematopoietic stem/progenitor cell function. Exp. Hematol. 33, 836–843 10.1016/j.exphem.2005.04.001 - DOI - PubMed
    1. Brooks P. C., Strömblad S., Sanders L. C., von Schalscha T. L., Aimes R. T., Stetler-Stevenson W. G., Quigley J. P., Cheresh D. A. (1996). Localization of matrix metalloproteinase MMP-2 to the surface of invasive cells by interaction with integrin αvβ3. Cell 85, 683–693 10.1016/S0092-8674(00)81235-0 - DOI - PubMed