

Segregation of PIP2 and PIP3 into distinct nanoscale regions within the plasma membrane
- PMID: 23213479
- PMCID: PMC3507238
- DOI: 10.1242/bio.20122071
Segregation of PIP2 and PIP3 into distinct nanoscale regions within the plasma membrane
Abstract
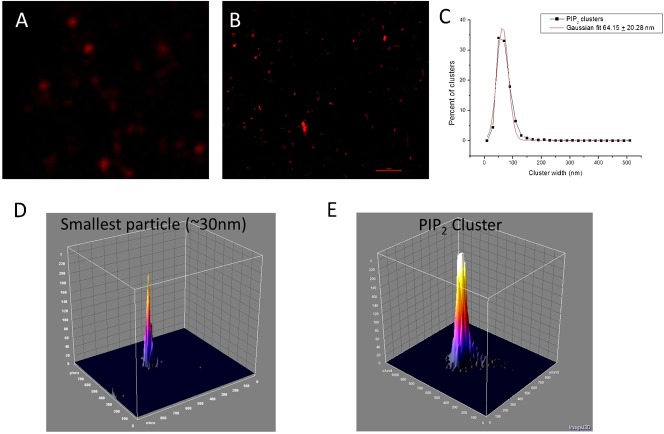
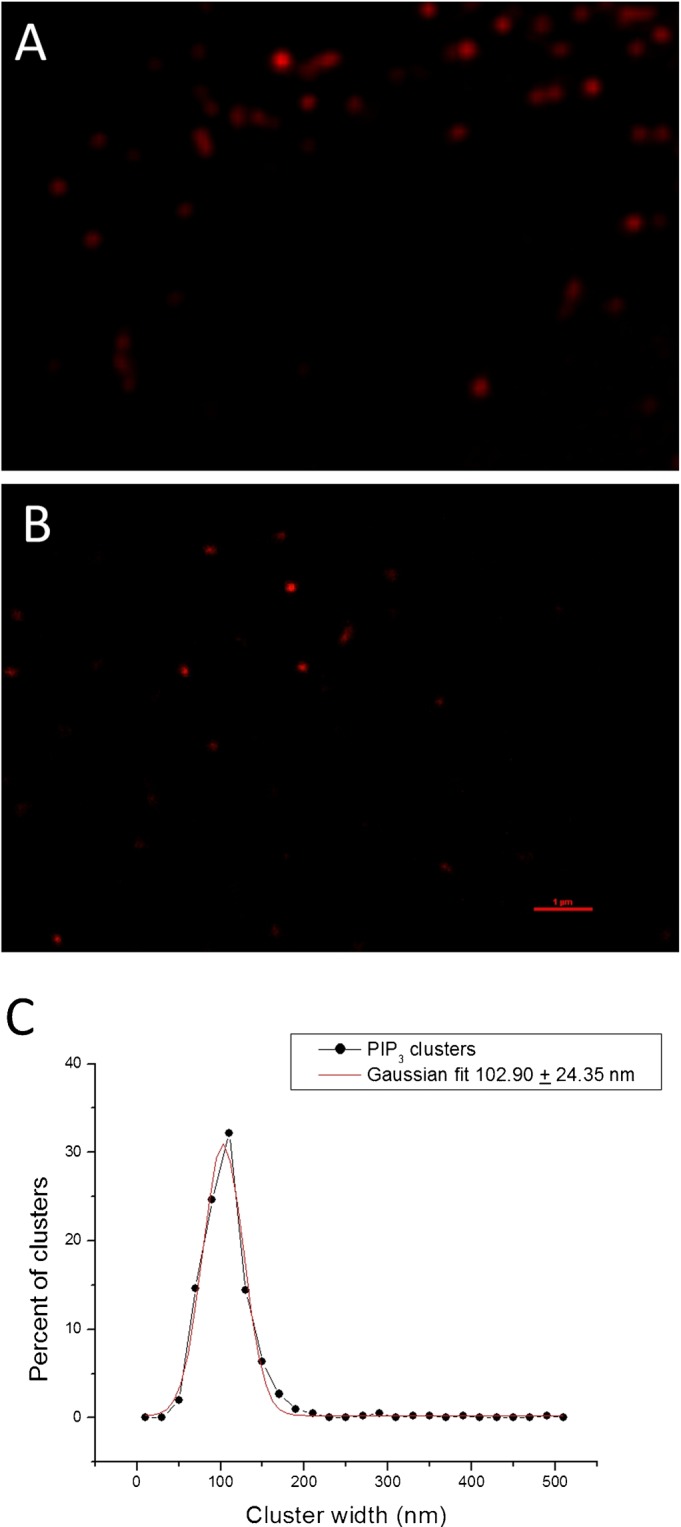
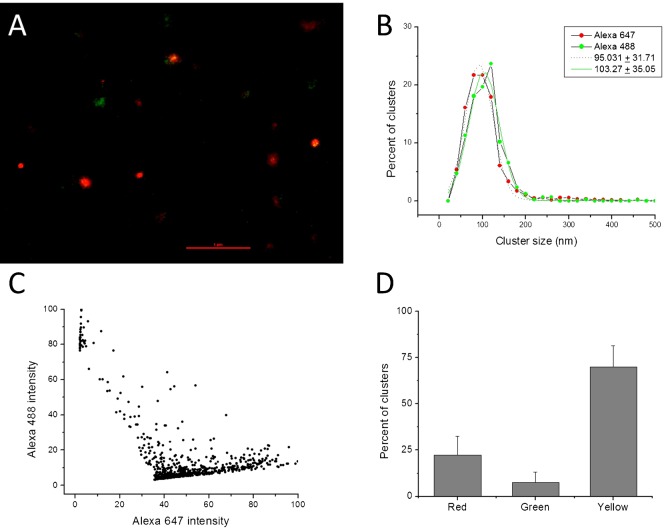
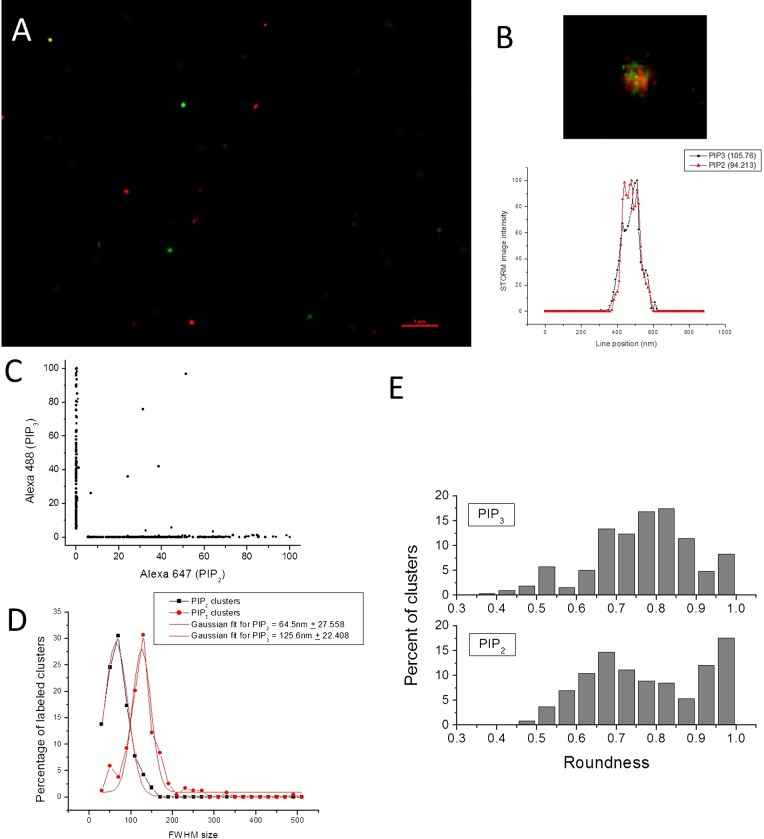
PIP(2) and PIP(3) are implicated in a wide variety of cellular signaling pathways at the plasma membrane. We have used STORM imaging to localize clusters of PIP(2) and PIP(3) to distinct nanoscale regions within the plasma membrane of PC12 cells. With anti-phospholipid antibodies directly conjugated with AlexaFluor 647, we found that PIP(2) clusters in membrane domains of 64.5±27.558 nm, while PIP(3) clusters had a size of 125.6±22.408 nm. With two color direct STORM imaging we show that >99% of phospholipid clusters have only one or other phospholipid present. These results indicate that lipid nano-domains can be readily identified using super-resolution imaging techniques, and that the lipid composition and size of clusters is tightly regulated.
Keywords: Lipid raft; PC12 cell; PIP2; PIP3.
Conflict of interest statement
Figures
Similar articles
-
Phospholipid-protein interactions of the plasma-membrane Ca2+-transporting ATPase. Evidence for a tissue-dependent functional difference.Biochem J. 1989 Nov 1;263(3):687-94. doi: 10.1042/bj2630687. Biochem J. 1989. PMID: 2532005 Free PMC article.
-
The complex and intriguing lives of PIP2 with ion channels and transporters.Sci STKE. 2001 Dec 4;2001(111):re19. doi: 10.1126/stke.2001.111.re19. Sci STKE. 2001. PMID: 11734659 Review.
-
Interactions and Translational Dynamics of Phosphatidylinositol Bisphosphate (PIP2) Lipids in Asymmetric Lipid Bilayers.Langmuir. 2016 Feb 23;32(7):1732-41. doi: 10.1021/acs.langmuir.5b02814. Epub 2016 Feb 12. Langmuir. 2016. PMID: 26829708
-
GRP1 pleckstrin homology domain: activation parameters and novel search mechanism for rare target lipid.Biochemistry. 2004 Dec 28;43(51):16161-73. doi: 10.1021/bi049017a. Biochemistry. 2004. PMID: 15610010 Free PMC article.
-
Cholesterol Regulation of Membrane Proteins Revealed by Two-Color Super-Resolution Imaging.Membranes (Basel). 2023 Feb 20;13(2):250. doi: 10.3390/membranes13020250. Membranes (Basel). 2023. PMID: 36837753 Free PMC article. Review.
Cited by
-
Dances with Membranes: Breakthroughs from Super-resolution Imaging.Curr Top Membr. 2015;75:59-123. doi: 10.1016/bs.ctm.2015.03.008. Epub 2015 Apr 15. Curr Top Membr. 2015. PMID: 26015281 Free PMC article. Review.
-
RAP GTPases and platelet integrin signaling.Platelets. 2019;30(1):41-47. doi: 10.1080/09537104.2018.1476681. Epub 2018 Jun 4. Platelets. 2019. PMID: 29863951 Free PMC article. Review.
-
Localization of the tubby domain, a PI(4,5)P2 biosensor, to E-Syt3-rich endoplasmic reticulum-plasma membrane junctions.J Cell Sci. 2023 Aug 1;136(15):jcs260848. doi: 10.1242/jcs.260848. Epub 2023 Aug 4. J Cell Sci. 2023. PMID: 37401342 Free PMC article.
-
Review of PIP2 in Cellular Signaling, Functions and Diseases.Int J Mol Sci. 2020 Nov 6;21(21):8342. doi: 10.3390/ijms21218342. Int J Mol Sci. 2020. PMID: 33172190 Free PMC article. Review.
-
Cetylpyridinium chloride (CPC) reduces zebrafish mortality from influenza infection: Super-resolution microscopy reveals CPC interference with multiple protein interactions with phosphatidylinositol 4,5-bisphosphate in immune function.Toxicol Appl Pharmacol. 2022 Apr 1;440:115913. doi: 10.1016/j.taap.2022.115913. Epub 2022 Feb 9. Toxicol Appl Pharmacol. 2022. PMID: 35149080 Free PMC article.
References
-
- Goebbels S., Oltrogge J. H., Kemper R., Heilmann I., Bormuth I., Wolfer S., Wichert S. P., Möbius W., Liu X., Lappe-Siefke C. et al. (2010). Elevated phosphatidylinositol 3,4,5-trisphosphate in glia triggers cell-autonomous membrane wrapping and myelination. J. Neurosci. 30, 8953–8964 10.1523/JNEUROSCI.0219-10.2010 - DOI - PMC - PubMed
Grants and funding
LinkOut - more resources
Full Text Sources
