

Carbonic anhydrase I as a new plasma biomarker for prostate cancer
- PMID: 23213568
- PMCID: PMC3506895
- DOI: 10.5402/2012/768190
Carbonic anhydrase I as a new plasma biomarker for prostate cancer
Abstract
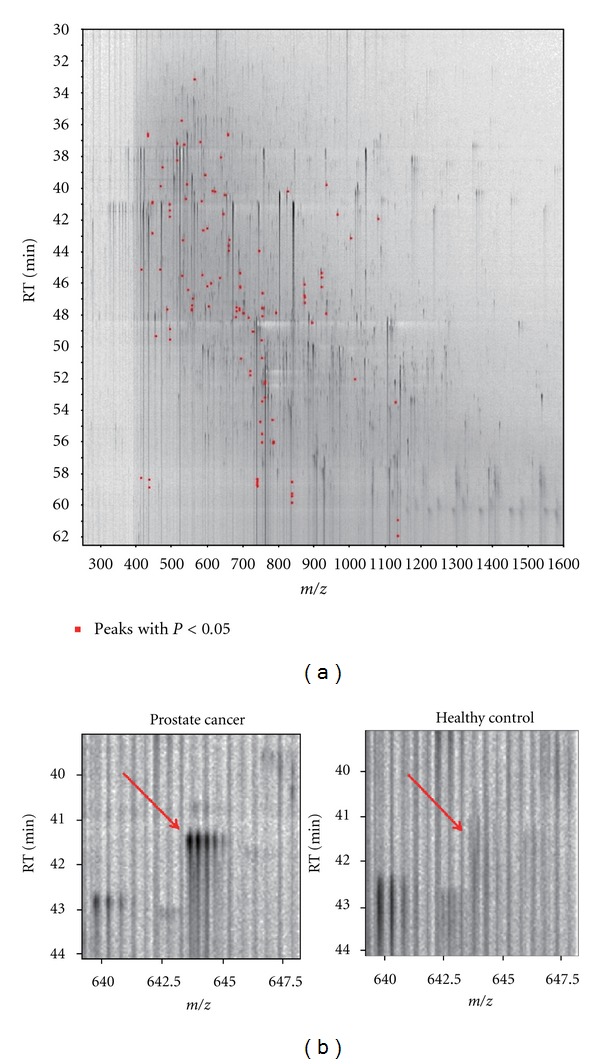
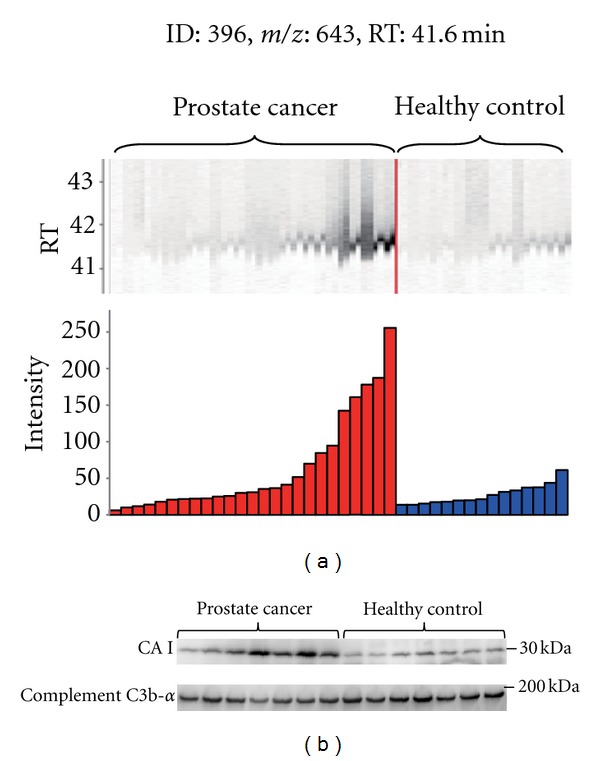
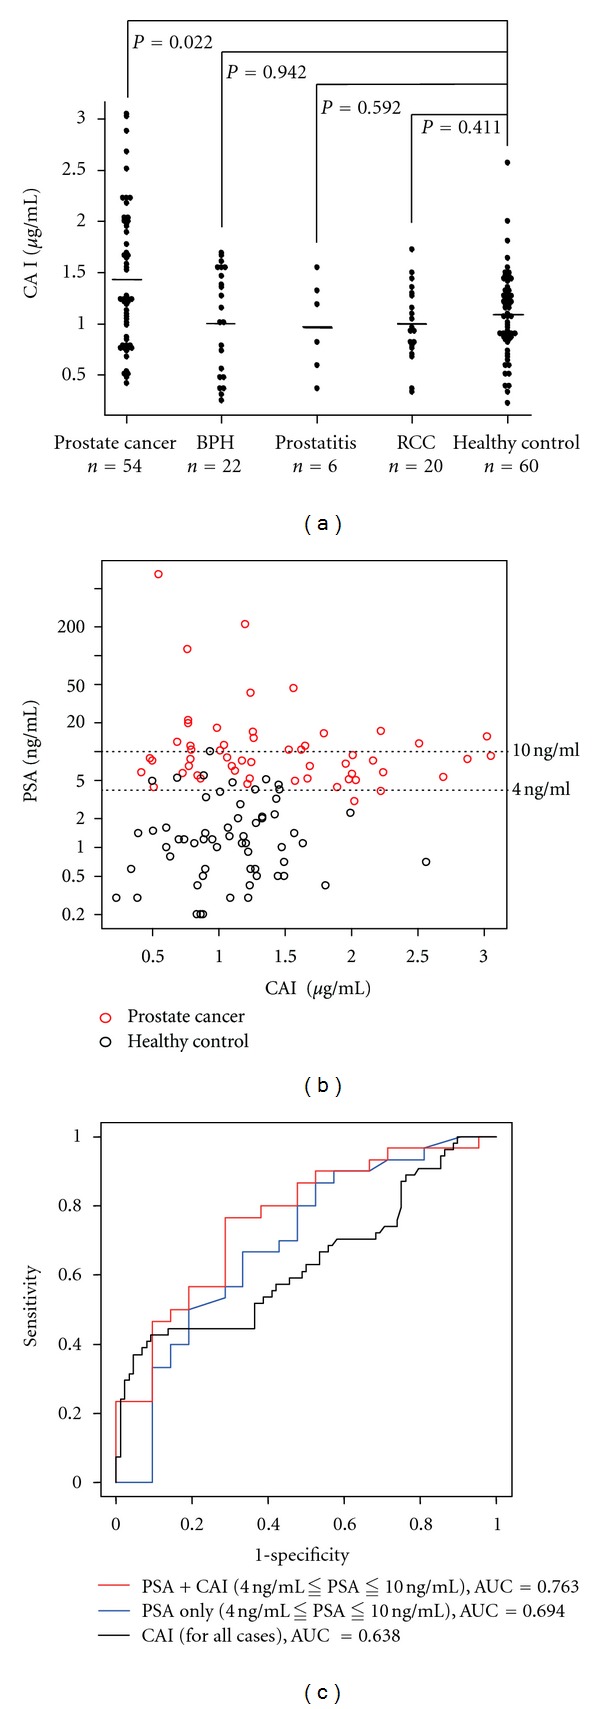
Serum prostate-specific antigen (PSA) levels ranging from 4 to 10 ng/mL is considered a diagnostic gray zone for detecting prostate cancer because biopsies reveal no evidence of cancer in 75% of these subjects. Our goal was to discover a new highly specific biomarker for prostate cancer by analyzing plasma proteins using a proteomic technique. Enriched plasma proteins from 25 prostate cancer patients and 15 healthy controls were analyzed using a label-free quantitative shotgun proteomics platform called 2DICAL (2-dimensional image converted analysis of liquid chromatography and mass spectrometry) and candidate biomarkers were searched. Among the 40,678 identified mass spectrum (MS) peaks, 117 peaks significantly differed between prostate cancer patients and healthy controls. Ten peaks matched carbonic anhydrase I (CAI) by tandem MS. Independent immunological assays revealed that plasma CAI levels in 54 prostate cancer patients were significantly higher than those in 60 healthy controls (P = 0.022, Mann-Whitney U test). In the PSA gray-zone group, the discrimination rate of prostate cancer patients increased by considering plasma CAI levels. CAI can potentially serve as a valuable plasma biomarker and the combination of PSA and CAI may have great advantages for diagnosing prostate cancer in patients with gray-zone PSA level.
Figures
References
-
- Jemal A, Siegel R, Ward E, Hao Y, Xu J, Thun MJ. Cancer statistics, 2009. CA—A Cancer Journal for Clinicians. 2009;59(4):225–249. - PubMed
-
- Catalona WJ, Smith DS, Ratliff TL, Basler JW. Detection of organ-confined prostate cancer is increased through prostate- specific antigen-based screening. JAMA. 1993;270(8):948–954. - PubMed
-
- Pannek J, Partin AW. Prostate-specific antigen: what’s new in 1997. Oncology. 1997;11(9):1273–1278. - PubMed
-
- Loeb S, Gashti SN, Catalona WJ. Exclusion of inflammation in the differential diagnosis of an elevated prostate-specific antigen (PSA) Urologic Oncology. 2009;27(1):64–66. - PubMed
-
- Catalona WJ, Richie JP, Ahmann FR, et al. Comparison of digital rectal examination and serum prostate specific antigen in the early detection of prostate cancer: Results of a multicenter clinical trial of 6,630 men. Journal of Urology. 1994;151(5):1283–1290. - PubMed
LinkOut - more resources
Full Text Sources
Research Materials
Miscellaneous
