. 2013 Jan 17;117(2):342-50.
doi: 10.1021/jp3101267. Epub 2013 Jan 7.

Tracking the mechanism of fibril assembly by simulated two-dimensional ultraviolet spectroscopy

Affiliations

Tracking the mechanism of fibril assembly by simulated two-dimensional ultraviolet spectroscopy

A R Lam et al. J Phys Chem A. .

Abstract

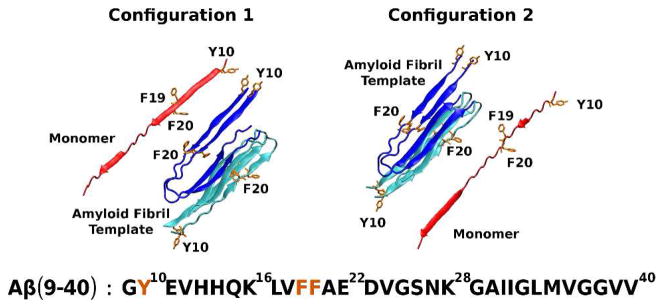
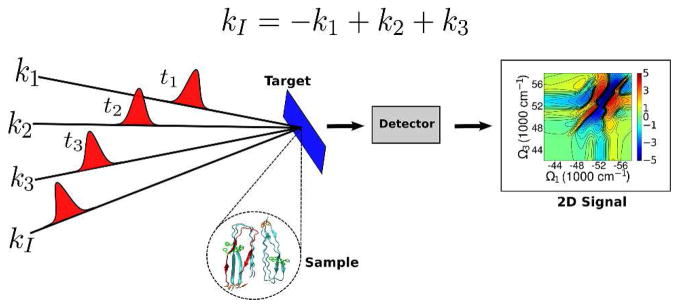
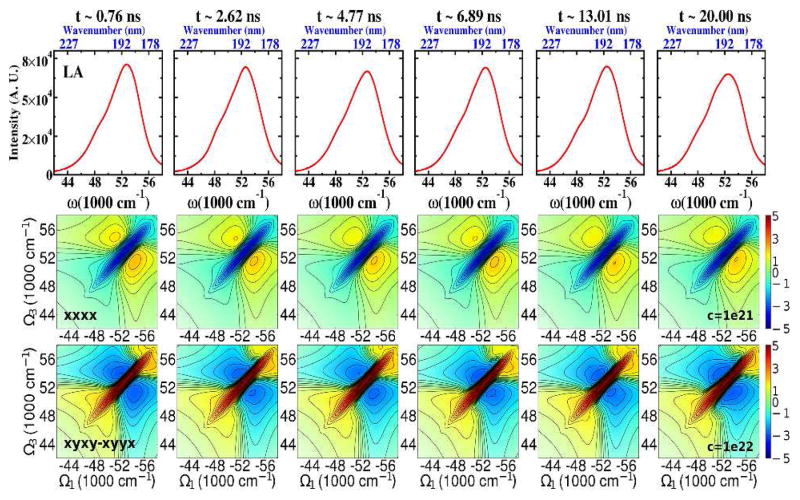
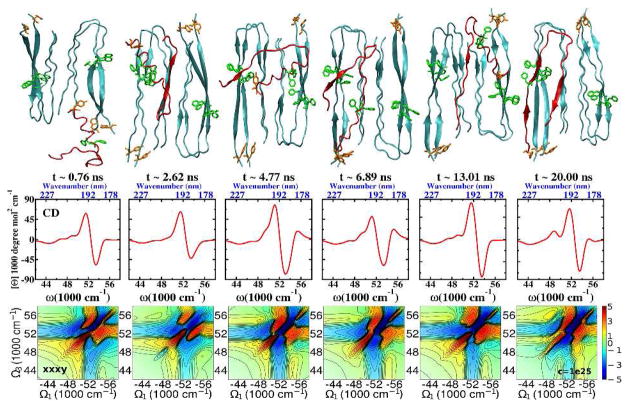
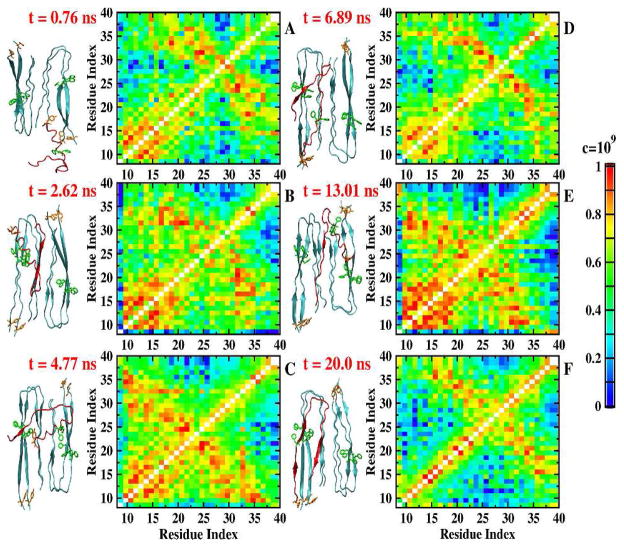
Alzheimer's disease (AD) is a neurodegenerative disorder characterized by the accumulation of plaque deposits in the human brain. The main component of these plaques consists of highly ordered structures called amyloid fibrils, formed by the amyloid β-peptide (Aβ). The mechanism connecting Aβ and AD is yet undetermined. In a previous study, a coarse-grained united-residue model and molecular dynamics simulations were used to model the growth mechanism of Aβ amyloid fibrils. On the basis of these simulations, a dock/lock mechanism was proposed, in which Aβ fibrils grow by adding monomers at either end of an amyloid fibril template. To examine the structures in the early time-scale formation and growth of amyloid fibrils, simulated two-dimensional ultraviolet spectroscopy is used. These early structures are monitored in the far ultraviolet regime (λ = 190-250 nm) in which the computed signals originate from the backbone nπ* and ππ* transitions. These signals show distinct cross-peak patterns that can be used, in combination with molecular dynamics, to monitor local dynamics and conformational changes in the secondary structure of Aβ-peptides. The protein geometry-correlated chiral xxxy signal and the non-chiral combined signal xyxy-xyyx were found to be sensitive to, and in agreement with, a dock/lock pathway.


Conflict of interest statement

The authors declare no competing financial interest

Figures

Figure 1
Figure 1
Initial configurations taken from Rojas et al.. Aβ(9–40) monomer (ribbon in red) is 20 Å away from the amyloid fibril template composed of two β-sheets of two Aβ monomers each (in navy and blue, respectively). The primary sequence of Aβ(9–40) is displayed below the Figures with the aromatic residues Tyr and Phe indicated in orange. Each monomer has one Tyr (Tyr10) and two Phe (Phe19 and Phe20) residues.
Figure 2
Figure 2
Configuration of pulses for a multidimensional four-laser mixing experiment. Three laser pulses with wave vectors k1, k2 and k3 (in their respective chronological order, t1, t2 and t3) interact with a target (a peptide or complex of peptides). A coherent signal field, kI = −k1 + k2 + k3, is also generated to enhance the output of the time-interval dependent signal S(t3,t2,t1) that carries information about the interactions and intensity changes and is collected by a detector. The signal is displayed as the two-dimensional Fourier transform of the times t1 → Ω1 and t3 → Ω3.
Figure 3
Figure 3
1D and 2D spectra in the FUV regime for Configuration 1 at different simulation times. Top: Linear Absorption (1D). Middle: The 2D non-chiral xxxx spectra. Bottom: The 2D non-chiral combination xyxy-xyyx signal. The non-chiral xxxx spectra have extended blue peaks at 52,000 cm −1, while the non-chiral combination xyxy-xyyx spectra have extended red peaks at that center. These peaks centered at 52,000 cm −1 correspond to the maxima in the LA signal displayed at the top row. The yellow cross-peaks in both non-chiral spectra correspond to the pairs of dipole-dipole interactions.
Figure 4
Figure 4
1D and 2D chiral signals in the FUV for Configuration 1 at different simulation times. Top Row: Representative snapshots (from ref. 47) of Aβ(9–40) monomer (red) interacting with the amyloid template (blue) at different simulation times. Aromatic residues, Tyr and Phe, are colored in orange and green, respectively. Middle Panels: circular dichroism. Bottom Panels: 2DFUV chiral xxxy spectra.
Figure 5
Figure 5
Maps A to F show the average chirality factor 〈CF(m,n)〉 (see Eq. 4) for ππ* transitions for Configuration 1 at different simulation times, indicated at the left of each map. A representative snapshot (obtained from ref. 47) of the A β(9–40) monomer (red) interacting with the amyloid template (blue) for the corresponding time, is also shown at the left of each map. Axes in each map correspond to the amino-acid residue index. Eq. 3 was used with a fixed value for c to highlight the contribution of a pair of amino-acid residues to the chirality factor.

Similar articles

Cited by

References

    1. Lorenzo A, Yuan M, Zhang Z, Paganetti PA, Sturchler-Pierrat C, Staufenbiel M, Mautino J, Vigo FS, Sommer B, Yankner BA. Nature Neurosci. 2000;3:460–464. - PubMed
    1. Walsh DM, Klyubin I, Fadeeva JV, Cullen WK, Anwy R, Wolfe MS, Rowan MJ, Selkoe DJ. Nature. 2002;416:535–539. - PubMed
    1. Selkoe DJ. Physio Rev. 2001;81:741–766. - PubMed
    1. Kirkitadze MD, Bitan G, Teplow DBJ. Neurosci Res. 2002;69:567–577. - PubMed
    1. Hardy J, Selkoe DJ. Science. 2002;297:353–356. - PubMed

Publication types