

Comparison of protein expression ratios observed by sixplex and duplex TMT labeling method
- PMID: 23214967
- PMCID: PMC3751587
- DOI: 10.1021/pr3008896
Comparison of protein expression ratios observed by sixplex and duplex TMT labeling method
Abstract
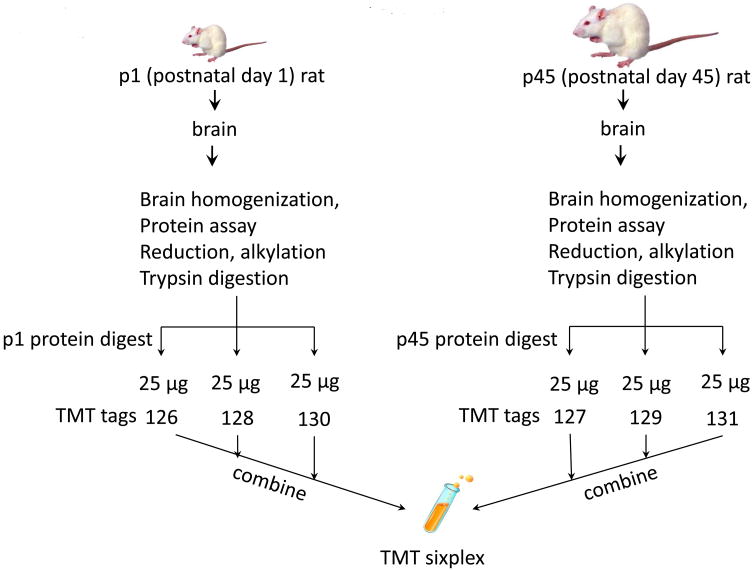
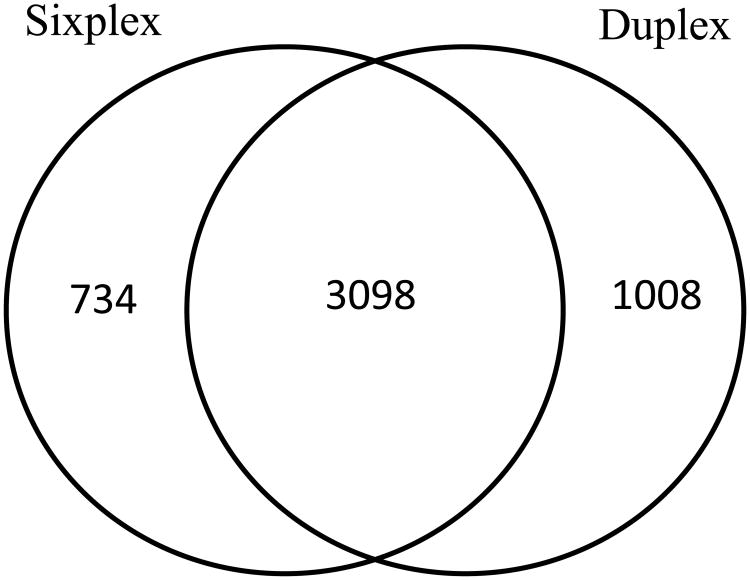
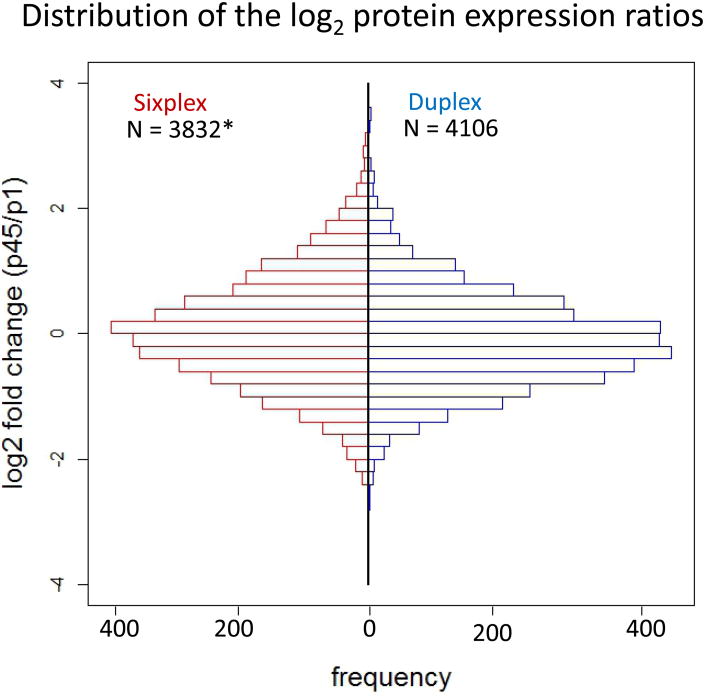
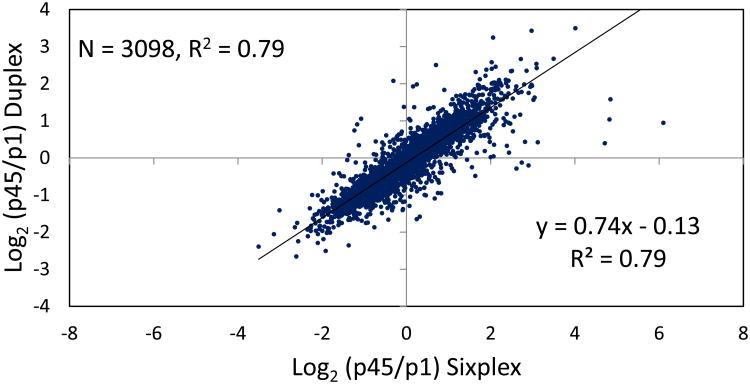
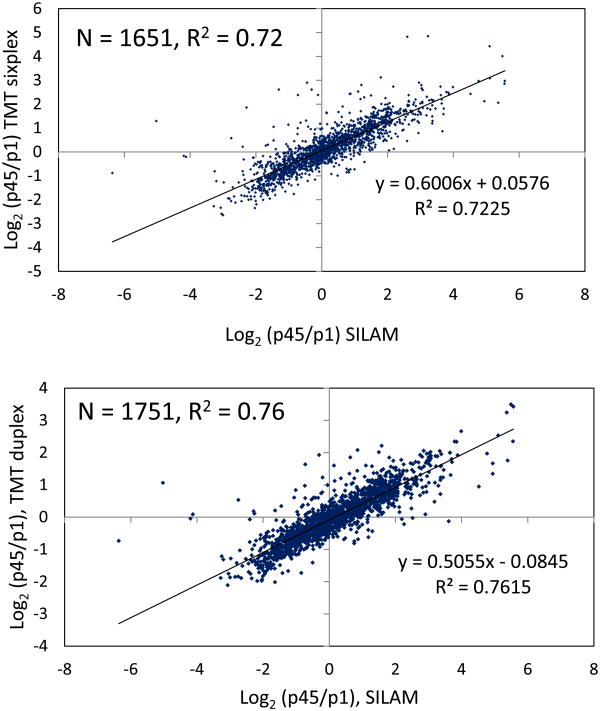
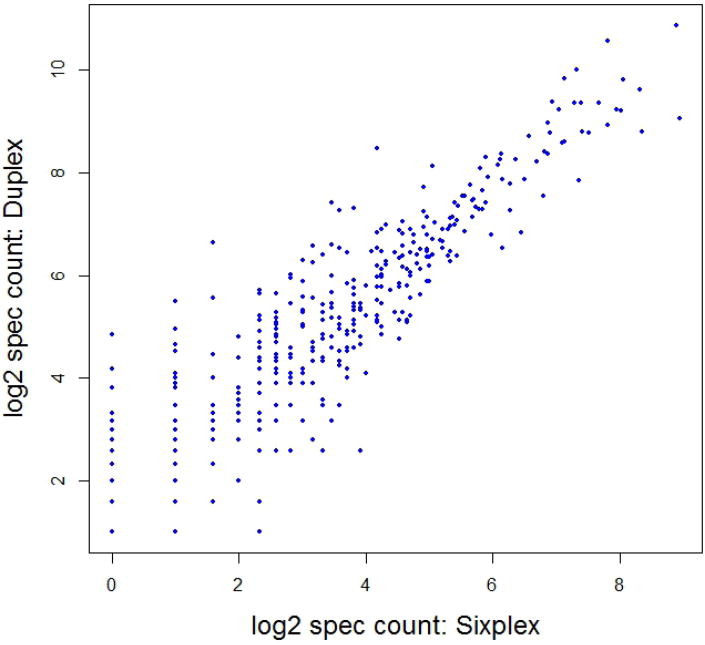
Stable isotope labeling via isobaric derivatization of peptides is a universally applicable approach that enables concurrent identification and quantification of proteins in different samples using tandem mass spectrometry. In this study, we evaluated the performance of amine-reactive isobaric tandem mass tag (TMT), available as duplex and sixplex sets, with regard to their ability to elucidate protein expression changes. Using rat brain tissue from two different developmental time points, postnatal day 1 (p1) and 45 (p45), as a model system, we compared the protein expression ratios (p45/p1) observed using duplex TMT tags in triplicate measurements versus sixplex tag in a single LC-MS/MS analysis. A correlation of 0.79 in relative protein abundance was observed in the proteins quantified by these two sets of reagents. However, more proteins passed the criteria for significant fold change (-1.0 ≤ log(2) ratio (p45/p1) ≥ +1.0 and p < 0.05) in the sixplex analysis. Nevertheless, in both methods most proteins showing significant fold change were identified by multiple spectra, increasing their quantification precision. Additionally, the fold change in p45 rats against p1, observed in TMT experiments, was corroborated by a metabolic labeling strategy where relative quantification of differentially expressed proteins was obtained using (15)N-labeled p45 rats as an internal standard.
Figures
References
-
- Wu CC, MacCoss MJ, Howell KE, Matthews DE, Yates JR., 3rd Metabolic labeling of mammalian organisms with stable isotopes for quantitative proteomic analysis. Analytical Chemistry. 2004;76(17):4951–9. - PubMed
-
- Ong SE, Blagoev B, Kratchmarova I, Kristensen DB, Steen H, Pandey A, Mann M. Stable isotope labeling by amino acids in cell culture, SILAC, as a simple and accurate approach to expression proteomics. Mol Cell Proteomics. 2002;1(5):376–86. - PubMed
-
- Gygi SP, Rist B, Gerber SA, Turecek F, Gelb MH, Aebersold R. Quantitative analysis of complex protein mixtures using isotope-coded affinity tags. Nature Biotechnology. 1999;17(10):994–9. - PubMed
-
- Ji C, Guo N, Li L. Differential dimethyl labeling of N-termini of peptides after guanidination for proteome analysis. J Proteome Res. 2005;4(6):2099–108. - PubMed
Publication types
MeSH terms
Substances
Grants and funding
LinkOut - more resources
Full Text Sources
