

Temporal trends in and relationships between screen time, physical activity, overweight and obesity
- PMID: 23216917
- PMCID: PMC3541208
- DOI: 10.1186/1471-2458-12-1060
Temporal trends in and relationships between screen time, physical activity, overweight and obesity
Abstract
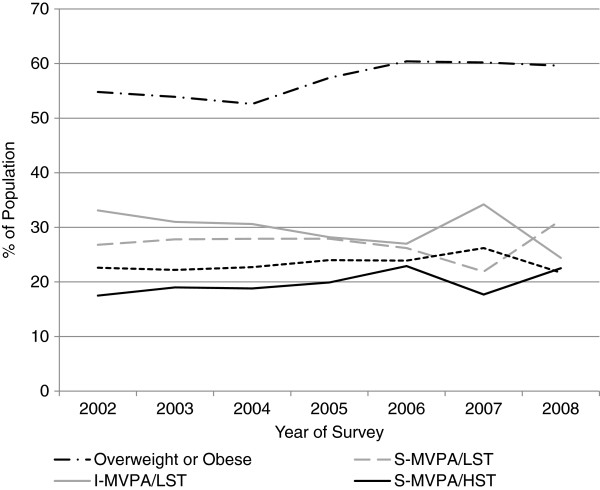
Background: The aims of this study were to examine temporal trends in the prevalence of sufficient moderate-to-vigorous intensity physical activity (MVPA), high levels of screen time, combined measures of these behaviors and overweight or obesity in Australian adults during the period 2002-2008. Trends over this time period in overweight or obesity within each behavior group (sufficient/insufficient MVPA, high/low screen time and combined behaviors) were also examined.
Methods: Data were collected via annually conducted cross-sectional computer-assisted-telephone-interviews (CATI) of adults (n=7908) living in Central Queensland, Australia (2002-2008). Self-reported MVPA, screen time (TV viewing and computer use), and BMI were used to create dichotomous classifications of physical activity (Sufficient MVPA (S-MVPA), Insufficient Physical Activity (I-MVPA)), screen time (High Screen Time (HST), Low Screen Time (LST)), combined behavior categories (S-MVPA/LST, I-MVPA/LST, S-MVPA/HST, I-MVPA/HST) and BMI (Overweight or Obese, Healthy Weight) respectively.
Results: The prevalence of S-MVPA, HST, and overweight or obesity increased at approximately the same rate over the study period in the overall sample and females (p≤0.05). In the overall sample and in females, the prevalence of overweight and obesity increased over the study period in those individuals classified as I-MVPA/HST (p≤0.05).
Conclusion: Results provide evidence that while the prevalence of S-MVPA appears to be modestly increasing, the proportion of the population engaging in HST and classified as overweight or obese are increasing at approximately the same rate. These observations highlight the need to increase levels of total physical activity (including light intensity physical activity) and decrease sedentary behavior including screen time.
Figures
References
-
- Bauman AE. Updating the evidence that physical activity is good for health: an epidemiological review 2000–2003. J Sci Med Sport. 2004;7(1 Suppl):6–19. - PubMed
-
- Brown W, Bauman A, Chey T, Trost S, Mummery K. Comparison of surveys used to measure physical activity. Aust N Z J Public Health. 2004;28(2):128–134. - PubMed
Publication types
MeSH terms
LinkOut - more resources
Full Text Sources
Medical
