. 2012 Dec 7:10:244.
doi: 10.1186/1479-5876-10-244.

Impact of apoptotic adipose-derived mesenchymal stem cells on attenuating organ damage and reducing mortality in rat sepsis syndrome induced by cecal puncture and ligation

Affiliations

Impact of apoptotic adipose-derived mesenchymal stem cells on attenuating organ damage and reducing mortality in rat sepsis syndrome induced by cecal puncture and ligation

Chia-Lo Chang et al. J Transl Med. .

Abstract

Background: We tested whether apoptotic adipose-derived mesenchymal stem cells (A-ADMSCs) were superior to healthy (H)-ADMSCs at attenuating organ damage and mortality in sepsis syndrome following cecal ligation and puncture (CLP).

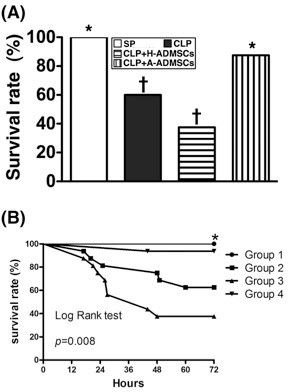
Methods: Adult male rats were categorized into group 1 (sham control), group 2 (CLP), group 3 [CLP + H-ADMSC administered 0.5, 6, and 18 h after CLP], group 4 [CLP + A-ADMSC administered as per group 3].

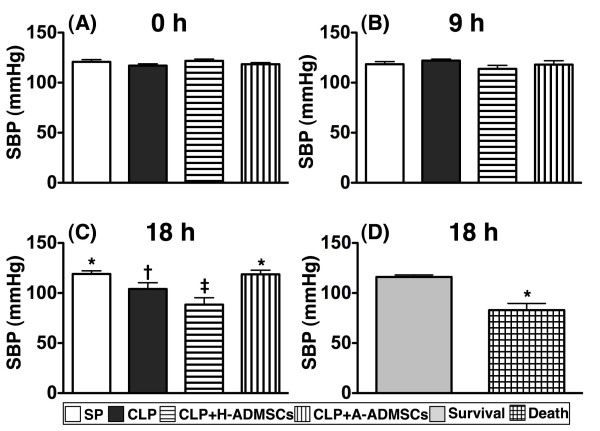
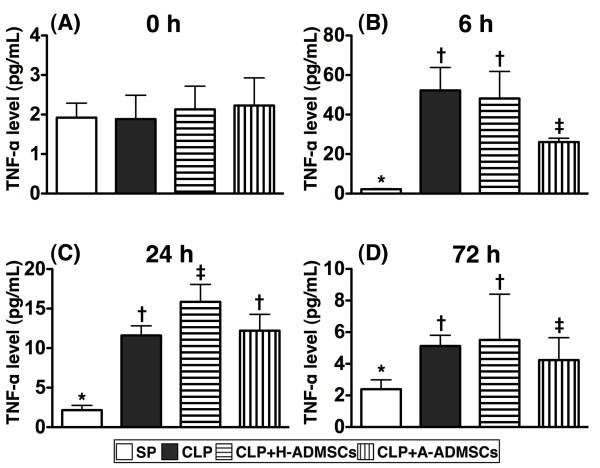
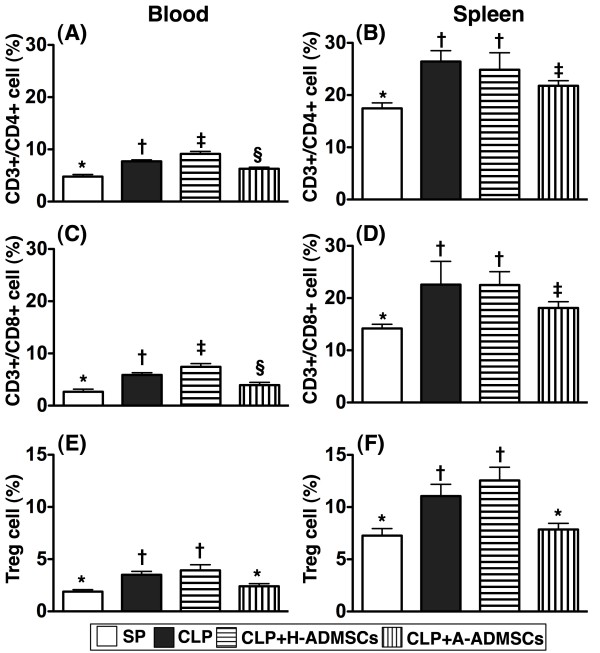
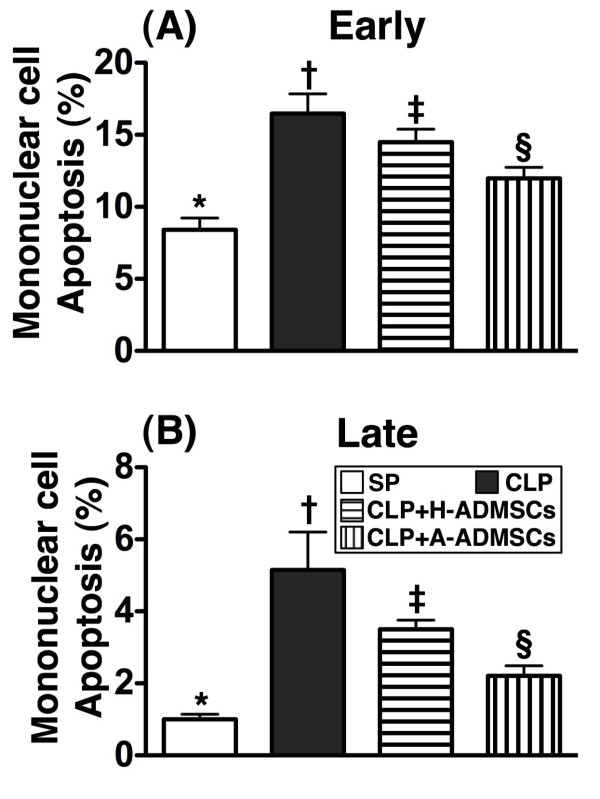
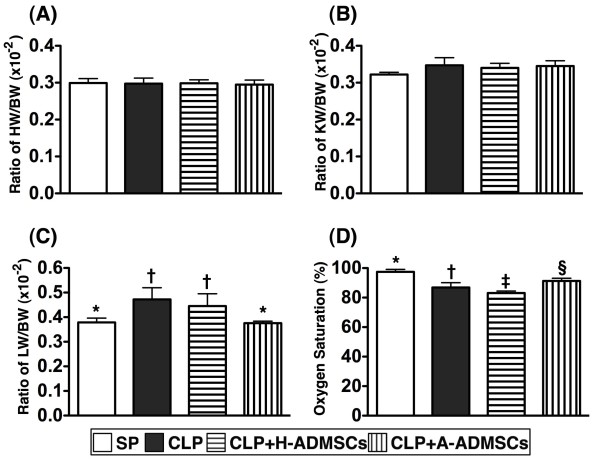
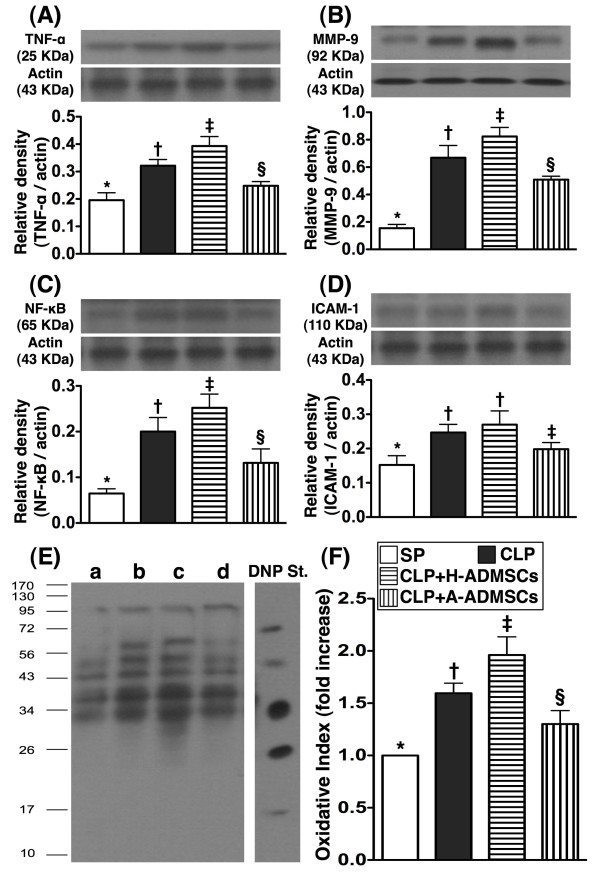
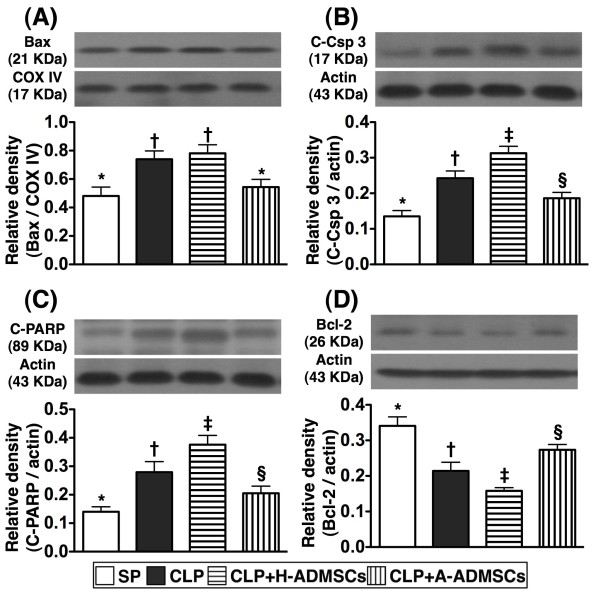
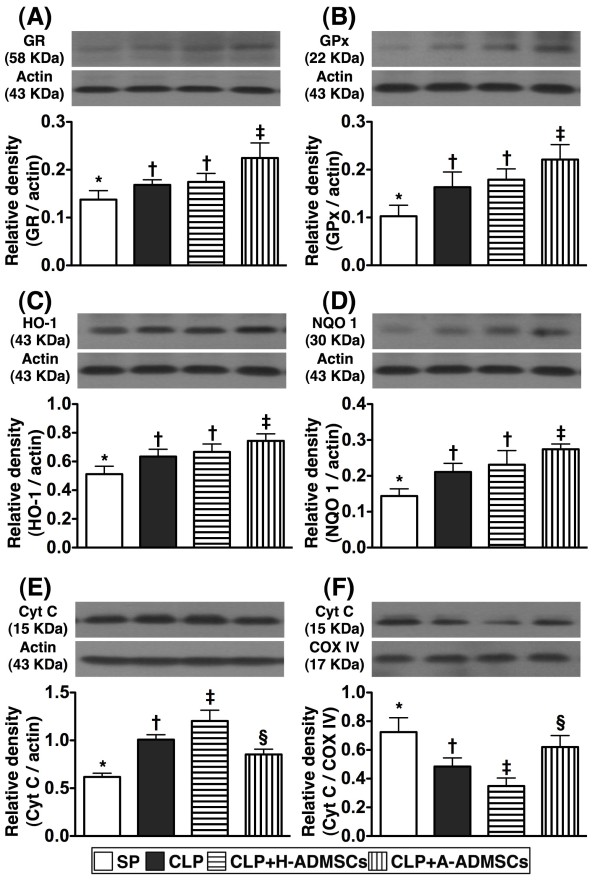
Results: Circulating peak TNF-α level, at 6 h, was highest in groups 2 and 3, and higher in group 4 than group 1 (p < 0.0001). Immune reactivity (indicated by circulating and splenic helper-, cytoxic-, and regulatory-T cells) at 24 and 72 h exhibited the same pattern as TNF-α amongst the groups (all p < 0.0001). The mononuclear-cell early and late apoptosis level and organ damage parameters of liver (AST, ALT), kidney (creatinine) and lung (arterial oxygen saturation) also displayed a similar pattern to TNF-α levels (all p < 0.001). Protein levels of inflammatory (TNF-α, MMP-9, NF-κB, ICAM-1), oxidative (oxidized protein) and apoptotic (Bax, caspase-3, PARP) biomarkers were higher in groups 2 and 3 than group 1, whereas anti-apoptotic (Bcl-2) biomarker was lower in groups 2 and 3 than in group 1 but anti-oxidant (GR, GPx, HO-1, NQO-1) showed an opposite way of Bcl-2; these patterns were reversed for group 4 (all p < 0.001). Mortality was highest in group 3 and higher in group 2 than group 4 than group 1 (all p < 0.001).

Conclusions: A-ADMSC therapy protected major organs from damage and improved prognosis in rats with sepsis syndrome.


Figures

Figure 1
Figure 1
Rat survival 72 h after cecal ligation and puncture(CLP)or sham procedure(SP).A) By 72 h after the CLP procedure, the survival rate of groups CLP and CLP + H-ADMSC were significantly lower than in groups SP and CLP + A-ADMSC (all p values < 0.05) but it showed no difference between groups CLP and CLP + H-ADMSC (p = p = 0.289) or between groups SP and CLP + A-ADMSC (p = 1.0). * vs. other bars with different symbols, p < 0.001. All statistical analyses performed using one-way ANOVA followed by Bonferroni multiple comparison post hoc test. Symbols (*, †) indicating statistical significance (at 0.05 level). B) Kaplan-Meyer analysis comparing survival amongst the four groups, demonstrating that 72 h cumulative mortality was significantly higher in the CLP + H-ADMSC group and untreated CLP group than in SP controls and A-ADMSC group (p < 0.001). There were no significant survival differences between groups SP and CLP + A-ADMSC (p = 1.0), or between groups CLP and CLP + H-ADMSC (p = 0.289). H-ADMSCs = healthy adipose-derived mesenchymal stem cells; A-ADMSCs = apoptotic adipose-derived mesenchymal stem cells.
Figure 2
Figure 2
Time course of systolic blood pressure (SBP) among the animals prior to and after cecal ligation and puncture(CLP)or sham procedure(SP).A) and B) The SBP at 0 h and at 9 h after CLP/SP were similar amongst the four groups. C) Illustrating the SBP at 24 h. * vs. other bars with different symbols, p < 0.001. D) Comparing the SBP at 24 hour after CLP/SP between the animals that ultimately survived and the animals that ultimately died. * vs. survival group, p < 0.0001. All statistical analyses utilized one-way ANOVA, followed by Bonferroni multiple comparison post hoc test. Symbols (*, †, ‡) indicating significance (at 0.05 level). CLP = cecal ligation and puncture; Normal indicates sham procedure; H-ADMSCs = healthy adipose-derived mesenchymal stem cells; A-ADMSCs = apoptotic adipose-derived mesenchymal stem cells.
Figure 3
Figure 3
Serial changes of circulating levels of tumor necrotic factor(TNF)-α.A) Circulating TNF-α levels did not differ amongst the four groups prior to CLP/SP. B) Circulating TNF-α levels amongst the four groups at 6 h after CLP/SP. * vs. other bars with different symbols, p < 0.0001. C) Circulating TNF-α levels amongst the four groups at 24 h after CLP/SP. * vs. other bars with different symbols, p < 0.0001. D) Circulating TNF-α levels amongst the four groups at 72 h after CLP/SP. * vs. other bars with different symbols, p < 0.001. All statistical analyses utilized one-way ANOVA, followed by Bonferroni multiple comparison post hoc test. Symbols (*, †, ‡) indicating significance (at 0.05 level). CLP = cecal ligation and puncture; Normal indicates sham procedure; H-ADMSCs = healthy adipose-derived mesenchymal stem cells; A-ADMSCs = apoptotic adipose-derived mesenchymal stem cells.
Figure 4
Figure 4
Circulating and splenic levels of T lymphocytes at 72 h after CLP/SP.A) Circulating levels of CD3+/CD4+ cells (helper T cells). * vs. other bars with different symbols, p < 0.001. B) Splenic levels of CD3+/CD4+ cells. * vs. other bars with different symbols, p < 0.001. C) Circulating levels of CD3+/CD8+ cells (cytotoxic T cells). * vs. other bars with different symbols, p < 0.001. D) Splenic levels of CD3+/CD8+ cells. * vs. other bars with different symbols, p < 0.001. E) Circulating levels of CD4 + CD25 + Foxp3+ cells (Treg cells). * vs. other bars with different symbols, p < 0.001. F) Splenic levels of Treg cells. * vs. other bars with different symbols, p < 0.001. All statistical analyses used one-way ANOVA, followed by Bonferroni multiple comparison post hoc test. Symbols (*, †, ‡, §) indicating significance (at 0.05 level). CLP = cecal ligation and puncture; Normal indicates sham procedure; H-ADMSCs = healthy adipose-derived mesenchymal stem cells; A-ADMSCs = apoptotic adipose-derived mesenchymal stem cells.
Figure 5
Figure 5
Circulating level of mononuclear cell apoptosis at 72 h after the CLP/SP.A) Early apoptosis. * vs. other bars with different symbols, p < 0.0001. B) Late apoptosis. * vs. other bars with different symbols, p < 0.0001. All statistical analyses used one-way ANOVA, followed by Bonferroni multiple comparison post hoc test. Symbols (*, †, ‡, §) indicating significance (at 0.05 level). CLP = cecal ligation and puncture; Normal indicates sham procedure; H-ADMSCs = healthy adipose-derived mesenchymal stem cells; A-ADMSCs = apoptotic adipose-derived mesenchymal stem cells.
Figure 6
Figure 6
Ratio of heart weight(HW),kidney weight(KW)and lung weight(LW)to the body weight(BW)at 72 h after CLP/SP.A) The ratio of HW to BW at 72 h after CLP/SP did not differ between the four groups. B) The ratio of KW to BW at 72 h after CLP/SP did not differ between the four groups. C) The ratio of LW to BW at 72 h after CLP/SP, respectively. * vs. other bars with different symbols, p < 0.001. D) The arterial oxygen saturation (%) at 72 h after CLP/SP. * vs. other bars with different symbols, p < 0.001. All statistical analyses used one-way ANOVA, followed by Bonferroni multiple comparison post hoc test. Symbols (*, †, ‡, §) indicating significance (at 0.05 level). CLP = cecal ligation and puncture; Normal indicates sham procedure; H-ADMSCs = healthy adipose-derived mesenchymal stem cells; A-ADMSCs = apoptotic adipose-derived mesenchymal stem cells.
Figure 7
Figure 7
Protein expressions of inflammatory and oxidative stress biomarkers of left ventricular myocardium at 72 h after CLP/SP.A, B and C) The protein expressions of tumor necrotic factor (TNF)-α (A), matrix metalloproteinase (MMP)-9 (B) and nuclear factor (NF)-κB (C) exhibited an identical pattern amongst the four groups. * vs. other bars with different symbols, p < 0.0001. D) The protein expression of intercellular adhesion molecule (ICAM)-1. * vs. other bars with different symbols, p < 0.0001. E &F) Expression of protein carbonyls (i.e., oxidized protein), an oxidative index, in the four groups of animals [Note: Right lane and left lane shown on left lower panel (E) representing control oxidized molecular protein standard and protein molecular weight marker, respectively]. DNP = 1-3 dinitrophenylhydrazone. * vs. other bars with different symbols, p < 0.0001. a = SP control; b = CLP; c = CLP + H-ADMSCs; d = CLP + A-ADMSCs. All statistical analyses used one-way ANOVA, followed by Bonferroni multiple comparison post hoc test. Symbols (*, †, ‡, §) indicating significance (at 0.05 level). CLP = cecal ligation and puncture; Normal indicates sham procedure; H-ADMSCs = healthy adipose-derived mesenchymal stem cells; A-ADMSCs = apoptotic adipose-derived mesenchymal stem cells.
Figure 8
Figure 8
Protein expressions of apoptotic and anti-apoptotic biomarkers of left ventricular myocardium at 72 h after CLP/SP.A, B and C) The protein expressions of mitochondrial Bax (A), cleaved casapse 3 (C-Csp 3) (B) and cleaved poly (ADP-ribose) polymerase (C-PARP) exhibited a similar pattern amongst the four groups. * vs. other bars with different symbols, p < 0.001. D) The protein expression of Bcl-2. * vs. other bars with different symbols, p < 0.001. All statistical analyses used one-way ANOVA, followed by Bonferroni multiple comparison post hoc test. Symbols (*, †, ‡, §) indicating significance (at 0.05 level). CLP = cecal ligation and puncture; Normal indicates sham procedure; H-ADMSCs = healthy adipose-derived mesenchymal stem cells; A-ADMSCs = apoptotic adipose-derived mesenchymal stem cells.
Figure 9
Figure 9
Protein expressions of anti-oxidant and mitochondrial preservation biomarkers of left ventricular myocardium at 72 h after CLP/SP.A, B, C and D) The protein expressions of glutathione reductase (GR) (A) glutathione peroxidase (GPx) (B), heme oxygenase (HO)-1 (C) and NAD(P)H quinone oxidoreductase (NQO) 1 (D) displayed an identical pattern amongst the four groups. * vs. other bars with different symbols, p < 0.001. E &F) Protein expression of cytosolic (E) and mitochondrial (F) cytochrome C (Cyt C). * vs. other bars with different symbols, p < 0.001. All statistical analyses used one-way ANOVA, followed by Bonferroni multiple comparison post hoc test. Symbols (*, †, ‡, §) indicating significance (at 0.05 level). CLP = cecal ligation and puncture; Normal indicates sham control; H-ADMSCs = healthy adipose-derived mesenchymal stem cells; A-ADMSCs = apoptotic adipose-derived mesenchymal stem cells.

References

    1. Angus DC, Linde-Zwirble WT, Lidicker J, Clermont G, Carcillo J, Pinsky MR. Epidemiology of severe sepsis in the United States: analysis of incidence, outcome, and associated costs of care. Crit Care Med. 2001;29:1303–1310. doi: 10.1097/00003246-200107000-00002. - DOI - PubMed
    1. Brun-Buisson C, Meshaka P, Pinton P, Vallet B. EPISEPSIS: a reappraisal of the epidemiology and outcome of severe sepsis in French intensive care units. Intensive Care Med. 2004;30:580–588. - PubMed
    1. Brun-Buisson C, Roudot-Thoraval F, Girou E, Grenier-Sennelier C, Durand-Zaleski I. The costs of septic syndromes in the intensive care unit and influence of hospital-acquired sepsis. Intensive Care Med. 2003;29:1464–1471. doi: 10.1007/s00134-003-1877-x. - DOI - PubMed
    1. Hotchkiss RS, Karl IE. The pathophysiology and treatment of sepsis. N Eng J Med. 2003;348:138–150. doi: 10.1056/NEJMra021333. - DOI - PubMed
    1. Venet F, Chung CS, Monneret G, Huang X, Horner B, Garber M, Ayala A. Regulatory T cell populations in sepsis and trauma. J Leukoc Biol. 2008;83:523–535. - PubMed

Publication types

MeSH terms