. 2012 Dec 5;16(6):777-88.
doi: 10.1016/j.cmet.2012.11.003.

Chronic caloric restriction preserves mitochondrial function in senescence without increasing mitochondrial biogenesis

Affiliations

Chronic caloric restriction preserves mitochondrial function in senescence without increasing mitochondrial biogenesis

Ian R Lanza et al. Cell Metab. .

Abstract

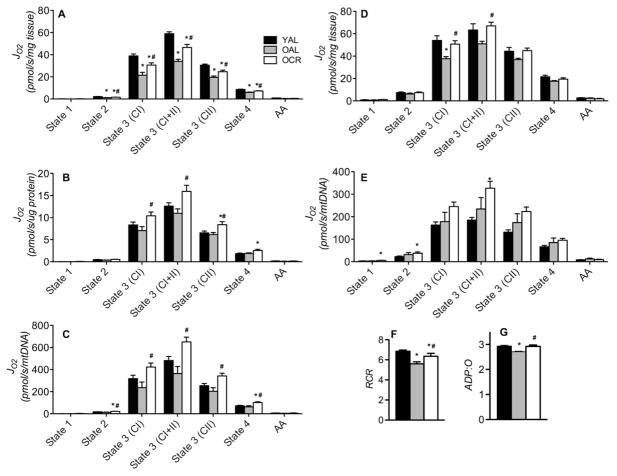
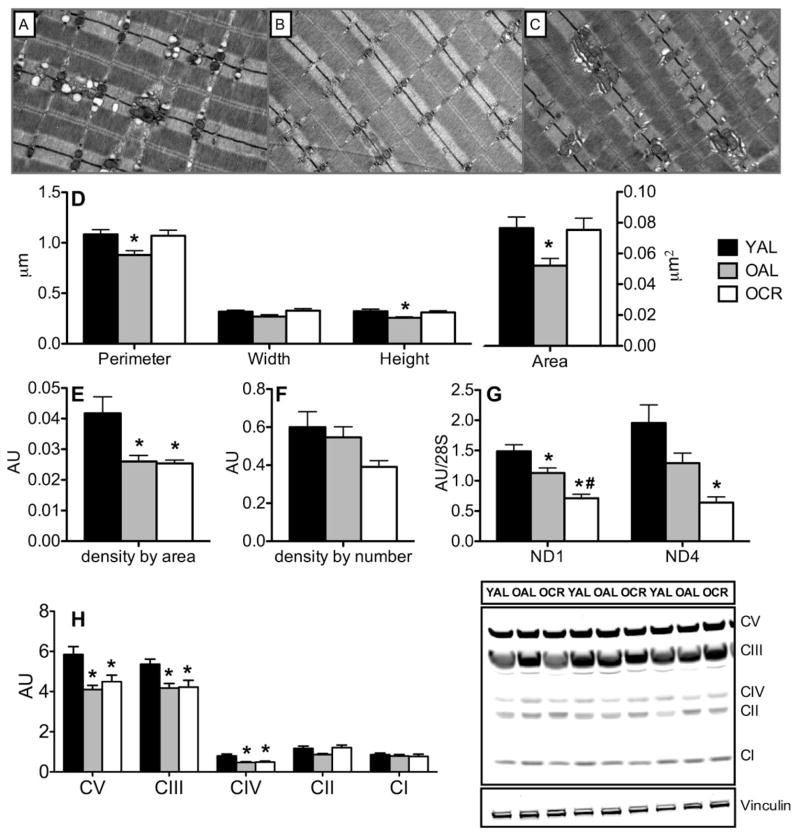
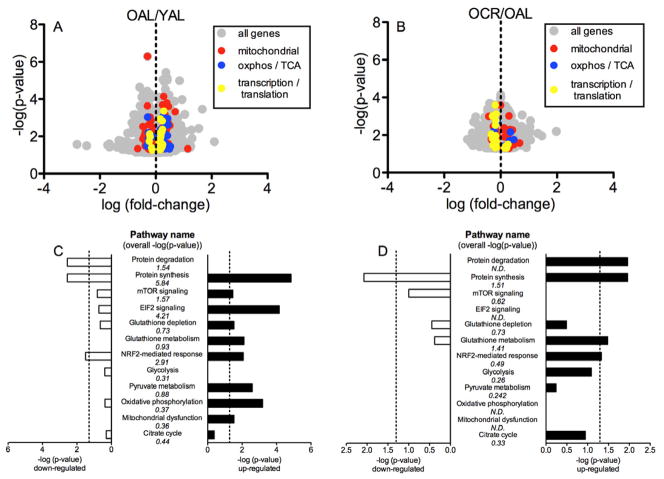
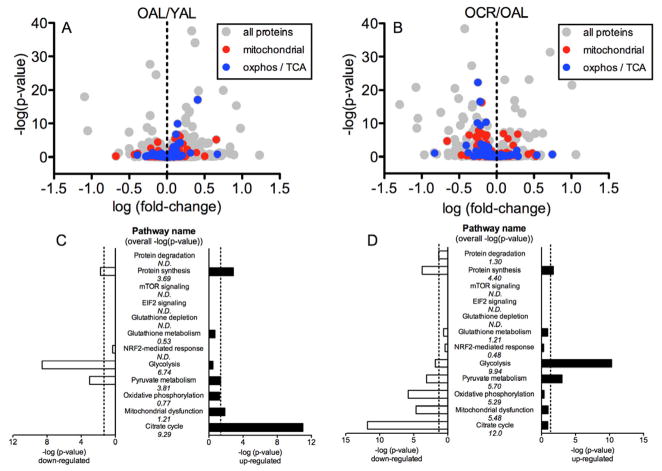
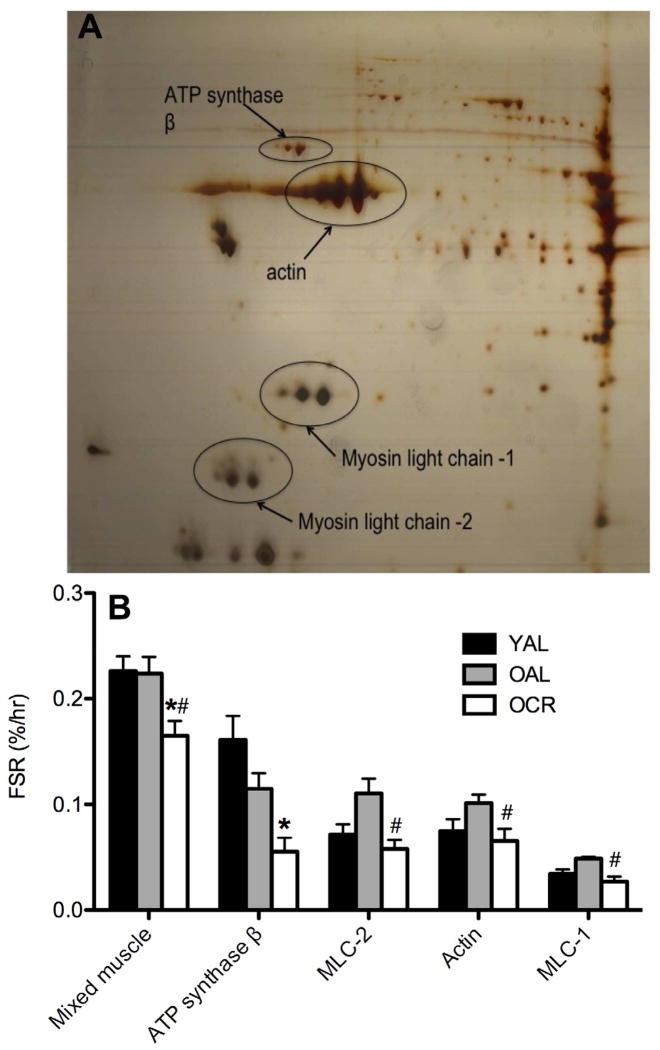
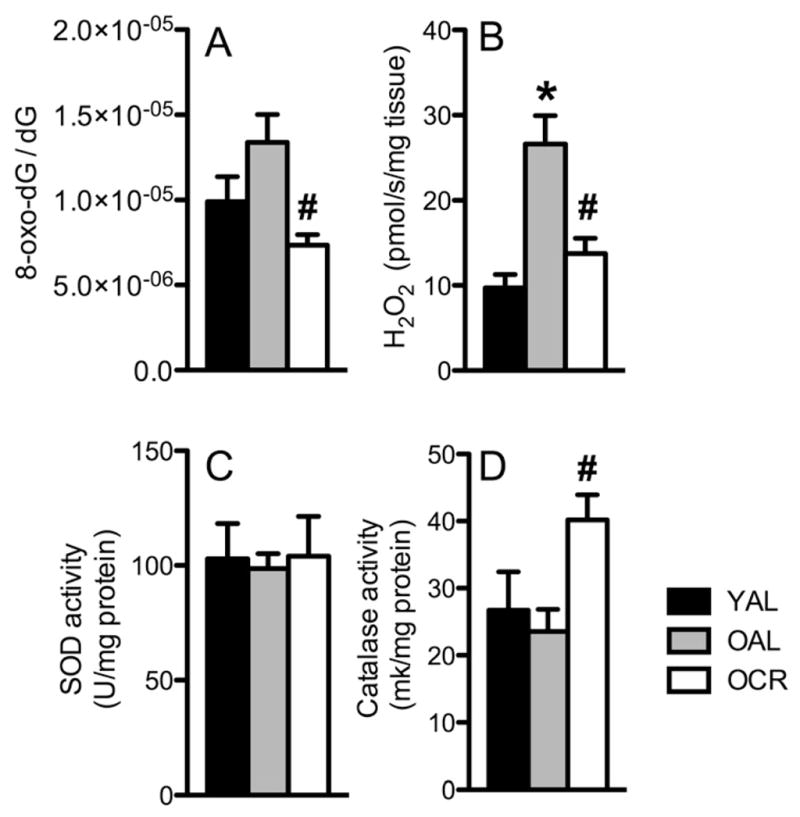
Caloric restriction (CR) mitigates many detrimental effects of aging and prolongs life span. CR has been suggested to increase mitochondrial biogenesis, thereby attenuating age-related declines in mitochondrial function, a concept that is challenged by recent studies. Here we show that lifelong CR in mice prevents age-related loss of mitochondrial oxidative capacity and efficiency, measured in isolated mitochondria and permeabilized muscle fibers. We find that these beneficial effects of CR occur without increasing mitochondrial abundance. Whole-genome expression profiling and large-scale proteomic surveys revealed expression patterns inconsistent with increased mitochondrial biogenesis, which is further supported by lower mitochondrial protein synthesis with CR. We find that CR decreases oxidant emission, increases antioxidant scavenging, and minimizes oxidative damage to DNA and protein. These results demonstrate that CR preserves mitochondrial function by protecting the integrity and function of existing cellular components rather than by increasing mitochondrial biogenesis.


Figures

Figure 1
Figure 1. Lifelong caloric restriction prevents age-related reduction in mitochondrial function in skeletal muscle
Respiration rates were measured in isolated mitochondria (A,B,C) and permeabilized fibers (D and E) with substrates targeting complex I (CI), complex I+II (CI+II), and complex II (CII). Non-mitochondrial oxygen consumption was measured in the presence of antimycin A (AA). In isolated mitochondria, respiration rates were expressed per tissue wet (A), mitochondrial protein content (B), and mitochondrial DNA copy number (C). In permeabilized muscle fibers, respiration rates were expressed per tissue wet (D) and mitochondrial DNA copy number (E). (F and G) Respiratory control ratio (RCR, state 3/state 4) and phosphorylation efficiency (ADP:O) were measured in isolated mitochondria. Bars represent means ± SEM for young ad libitum mice (YAL), old ad libitum mice (OAL), and old caloric restricted mice (OCR). * represents significant statistical differences from YAL (P<0.05, Tukey’s HSD). # represents significant statistical differences from OAL (P<0.05, Tukey’s HSD). N=6–8 per group.
Figure 2
Figure 2. Caloric restriction does not attenuate the reduction in skeletal muscle mitochondrial abundance with aging
(A,B,C) Representative transmission electron micrographs (25,000 × magnification) of skeletal muscle from YAL (A), OAL (B), and OCR (C) mice. (D) Average perimeter, width, height, and area of mitochondria were measured from digitized images (N=7–8 per group). (E and F) Mitochondrial density by area and density by number were determined from digitized electron micrographs (N=7–8 per group). (G) Mitochondrial DNA abundance was measured by rt-PCR using mitochondrial-encoded NADH dehydrogenase subunits 1 (ND1) and 4 (ND4), expressed relative to 28S as a nuclear housekeeping gene (N=10–12 per group). (H) Respiratory chain protein expression was measured by immunoblot in skeletal muscle lysates and normalized to vinculin as a loading control. Bars represent means ± SEM for young ad libitum mice (YAL), old ad libitum mice (OAL), and old caloric restricted mice (OCR). * represents significant statistical differences from YAL (P<0.05, Tukey’s HSD). # represents significant statistical differences from OAL (P<0.05, Tukey’s HSD). See also figure S1
Figure 3
Figure 3. Whole-genome profiling reveals no transcriptional evidence of increased mitochondrial biogenesis with caloric restriction
(A and B) Volcano plots of genes that were found to be differentially expressed in OAL vs. YAL (A) and OCR vs. OAL (B), measured by microarray. (C and D) Canonical pathways related to mitochondrial energy metabolism, protein turnover, and oxidative stress were assessed from gene expression patterns using Ingenuity Pathway Analysis (IPA). P-values under the pathway name are presented as their −log10 derivatives and were derived using both up-and down-regulated genes involved in each pathway. Histogram bars represent −log10 P-values for each pathway using either exclusively up-regulated genes (black bars) or exclusively down-regulated genes (white bars). Dotted vertical lines represent the threshold for statistical significance (P<0.05, −log(P-value) > 1.301). See also Tables S2, S3, S4, S5, S6, S7.
Figure 4
Figure 4. Quantitative proteomics by SILAC mouse reveals decreased expression of mitochondrial proteins with caloric restriction
(A and B) Volcano plots of proteins that were differentially expressed in OAL vs. YAL (A) and OCR vs. OAL (B), measured by using SILAC mouse tissues and mass spectrometry. (C and D) Canonical pathways related to mitochondrial energy metabolism, protein turnover, and oxidative stress were assessed from protein expression patterns using Ingenuity Pathway Analysis. P-values under the pathway name were derived using both up-and down-regulated proteins involved in each pathway. Histogram bars represent P-values for each pathway using either exclusively up-regulated proteins (black bars) or exclusively down-regulated proteins (white bars). Dotted vertical lines represent the threshold for statistical significance (P<0.05, −log(P-value) > 1.301). See also Tables S8, S9, S10, S11, S12, S13.
Figure 5
Figure 5. Caloric restriction decreases whole-muscle protein synthesis and fractional synthesis rates of individual proteins
(A) Representative silver-stained 2D gel separation of individual skeletal muscle proteins. (B) Fractional synthesis rates of whole tissue (mixed muscle) and individual skeletal muscle proteins measured by in vivo labeling by intravenous injection of 13C6 phenylalanine and mass spectrometry. MLC-1 is myosin light chain 1. MLC-2 is myosin light chain 2. Bars represent means ± SEM for young ad libitum mice (YAL), old ad libitum mice (OAL), and old caloric restricted mice (OCR). * represents significant statistical differences from YAL (P<0.05, Tukey’s HSD). # represents significant statistical differences from OAL (P<0.05, Tukey’s HSD). (N=5–8 per group).
Figure 6
Figure 6. Caloric restriction decreases cellular oxidative damage decreases mitochondrial oxidant emission, and increases antioxidant defenses
(A) Skeletal muscle oxidative damage was determined from 8-Oxo-2′-deoxyguanosine (8-oxo-dG); a major product of DNA oxidation measured by mass spectrometry (N=10–12 per group). (B) Hydrogen peroxide (H2O2) emission was measured in permeabilized muscle fibers by spectrofluorometry. (C) Maximal activities of superoxide dismutase (D) and catalase were measured by spectrophotometric methods in skeletal muscle homogenates. Bars represent means ± SEM for young ad libitum mice (YAL), old ad libitum mice (OAL), and old caloric restricted mice (OCR). * represents significant statistical differences from YAL (P<0.05, Tukey’s HSD). # represents significant statistical differences from OAL (P<0.05, Tukey’s HSD). (N=5–9 per group)

References

    1. Anderson EJ, Lustig ME, Boyle KE, Woodlief TL, Kane DA, Lin CT, Price JW, 3rd, Kang L, Rabinovitch PS, Szeto HH, et al. Mitochondrial H2O2 emission and cellular redox state link excess fat intake to insulin resistance in both rodents and humans. J Clin Invest. 2009;119:573–581. - PMC - PubMed
    1. Baker DJ, Betik AC, Krause DJ, Hepple RT. No decline in skeletal muscle oxidative capacity with aging in long-term calorically restricted rats: effects are independent of mitochondrial DNA integrity. J Gerontol A Biol Sci Med Sci. 2006;61:675–684. - PubMed
    1. Cahill GF., Jr Starvation in man. N Engl J Med. 1970;282:668–675. - PubMed
    1. Cahill GF, Jr, Herrera MG, Morgan AP, Soeldner JS, Steinke J, Levy PL, Reichard GA, Jr, Kipnis DM. Hormone-fuel interrelationships during fasting. J Clin Invest. 1966;45:1751–1769. - PMC - PubMed
    1. Calleja M, Pena P, Ugalde C, Ferreiro C, Marco R, Garesse R. Mitochondrial DNA remains intact during Drosophila aging, but the levels of mitochondrial transcripts are significantly reduced. J Biol Chem. 1993;268:18891–18897. - PubMed

Publication types

Associated data