. 2012 Dec 5;16(6):833-45.
doi: 10.1016/j.cmet.2012.11.004.

Circadian oscillations of protein-coding and regulatory RNAs in a highly dynamic mammalian liver epigenome

Affiliations

Circadian oscillations of protein-coding and regulatory RNAs in a highly dynamic mammalian liver epigenome

Christopher Vollmers et al. Cell Metab. .

Abstract

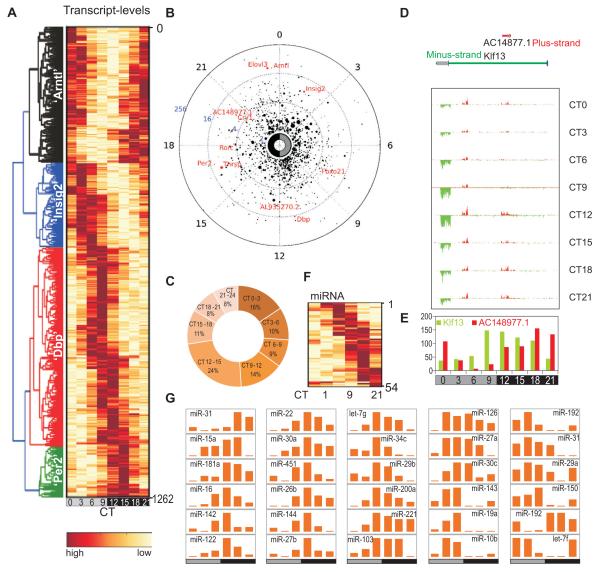
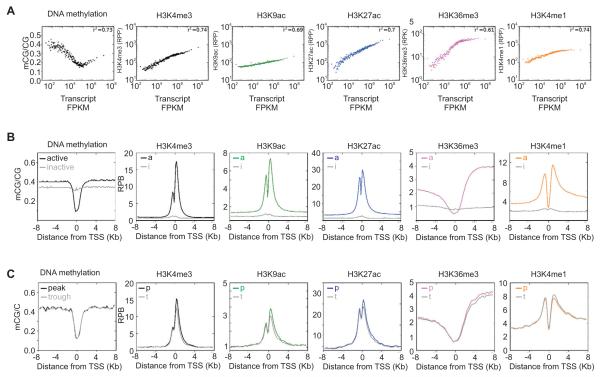
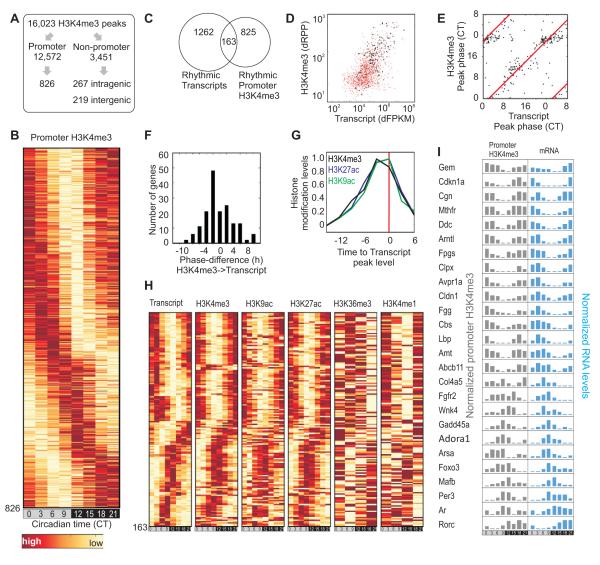
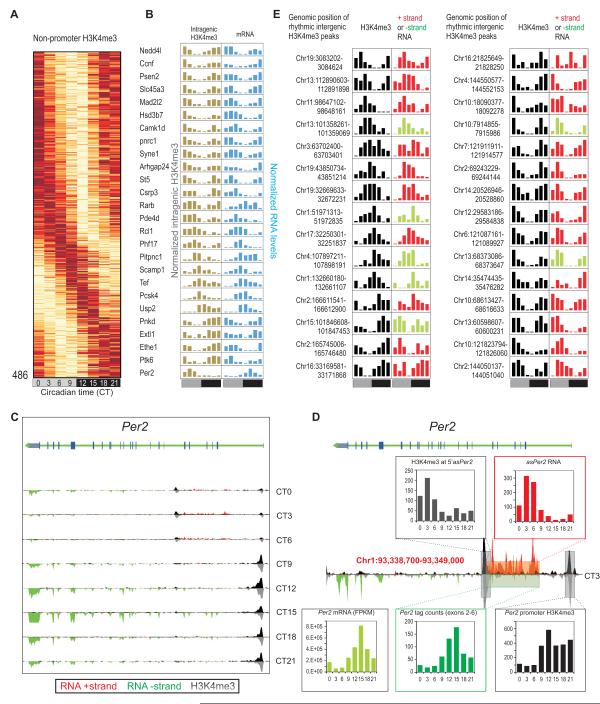
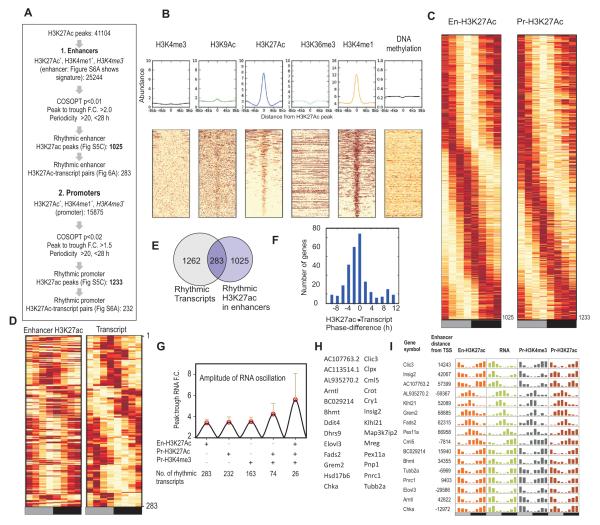
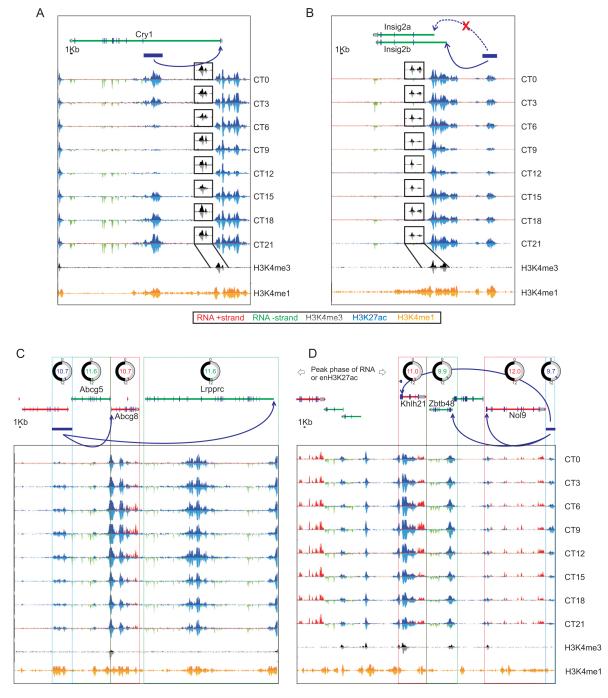
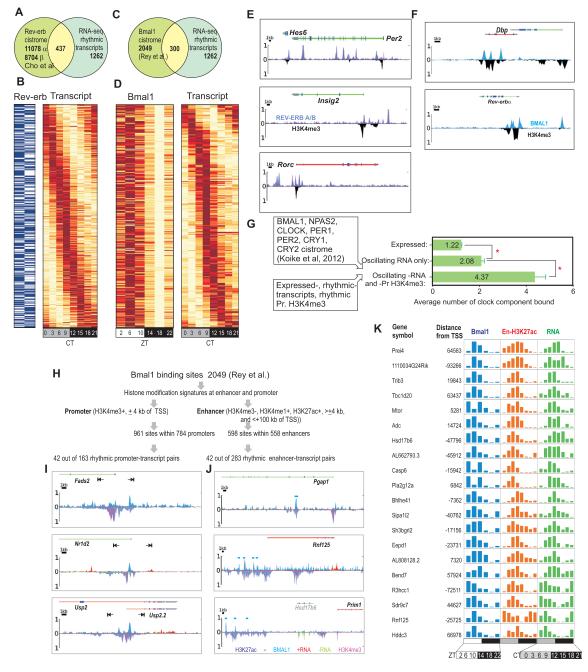
In the mouse liver, circadian transcriptional rhythms are necessary for metabolic homeostasis. Whether dynamic epigenomic modifications are associated with transcript oscillations has not been systematically investigated. We found that several antisense RNA, lincRNA, and microRNA transcripts also showed circadian oscillations in adult mouse livers. Robust transcript oscillations often correlated with rhythmic histone modifications in promoters, gene bodies, or enhancers, although promoter DNA methylation levels were relatively stable. Such integrative analyses identified oscillating expression of an antisense transcript (asPer2) to the gene encoding the circadian oscillator component Per2. Robust transcript oscillations often accompanied rhythms in multiple histone modifications and recruitment of multiple chromatin-associated clock components. Coupling of cycling histone modifications with nearby oscillating transcripts thus established a temporal relationship between enhancers, genes, and transcripts on a genome-wide scale in a mammalian liver. The results offer a framework for understanding the dynamics of metabolism, circadian clock, and chromatin modifications involved in metabolic homeostasis.


Figures

Figure 1
Figure 1. Strand specific and small RNA-Sequencing identified oscillating sense-, antisense-, and mi-RNA transcripts in the mouse liver
1,262 oscillating transcripts are shown in a (A) heatmap or (B) polar plot. In polar plot, peak-phase is shown along the radial coordinate, the distance to the center of the circle shows the amplitude of transcript oscillation. Average transcript levels over 24 h are proportional to the radius of the marker. Examples of known oscillating transcripts are shown in red. (C) Frequency plot percentage of oscillating transcripts with peak phase of expression binned in 3h over 24h. (D) Klf13/AC148977.1 locus shows oscillations in both sense and antisense transcripts. RNA levels on the plus (red) and minus (green) strands are in 150 bp bins and visualized for each time point. (E) Antisense transcript AC148977.1 (red) and Klf13 (green) are plotted. (F) 54 oscillating miRNAs are shown in a heatmap. (G) Normalized tag counts of example miRNAs show circadian oscillations.
Figure 2
Figure 2. Temporal changes in histone modifications at oscillating loci are distinct from differences in histone modification signatures at expressed and silent loci
(A) Scatter plot of transcript levels (x-axis) and the indicated epigenomic feature (y-axis). RNA, histone modification and DNA methylation at promoter or gene body regions of 14,492 expressed genes were grouped in bins of 100 and median normalized. H3K4me3, H3K4me1, H3K9ac and H3K27ac are shown as reads per promoters (RPP) while H3K36me3 is shown as reads per kilobase of gene body (RPK). DNA methylation is shown as the ratio of methylated CG to total CG in the promoters (±4 kb). (B) Average enrichment patterns of histone modifications and the extent of DNA methylation is shown in the promoter areas of active vs. inactive genes. The y-axis shows the extent of enrichment in reads per 150 bp bins (RPB). (C) Average DNA methylation and histone modifications in the promoters of ~700 oscillating genes at either peak (p) or trough (t) of transcript levels.
Figure 3
Figure 3. Oscillating H3K4me3 identified highly dynamic histone modifications at promoters
(A) Schematics for identification of oscillating H3K4me3 peaks. (B) Heatmap rendering of oscillating promoter H3K4me3 levels at 826 loci. (C) Venn diagram of overlap between oscillating transcripts and oscillating H3K4me3 at their promoters. (D) The absolute changes of transcript (dFPKM) and H3K4me3 (dRPP) levels of 1,262 oscillating genes are shown in a scatter plot in red. 163 loci with oscillating H3K4me3 levels are shown in black. (E) Scatter plot of the peak phase of transcript (x-axis) and H3K4me3 (y-axis) at 163 oscillating transcript-H3K4me3 pairs. (F) Difference in peak phase between transcript and H3K4me3 levels. (G) Histone modification levels in 163 oscillating loci are normalized relative to transcript peak time. (H) Heat map representation of the levels of transcript, H3K4me3, H3K9ac, H3K27ac H3K36me3 (gene body) and H3K4me1 levels in 163 oscillating transcript-promoter H3K4me3 pairs. (I) Examples of temporally correlated oscillating promoter H3K4me3 levels and transcript. Gene symbols, normalized histone modification levels and transcript levels are shown.
Figure 4
Figure 4. Oscillating H3K4me3 marks unannotated transcribed loci including asPer2
(A) Heatmap rendering of oscillating non-promoter H3K4me3. (B) Examples of genes with intragenic oscillating H3K4me3 and oscillating transcripts showing temporally correlated H3K4me3 and transcript rhythms except Per2. (C) Per2 locus shows rhythmic expression of both sense and an antisense transcript. Transcript (red/green) and H3K4me3 (black/grey) levels, binned in 150 bp bins for both ‘+’ and ‘−’ strands are shown. (D) Data for CT3 is shown magnified to highlight the asPer2 transcript. Inset histograms report oscillations in H3K4me3 levels at the potential TSS of asPer2, asPer2 RNA levels, Per2 mRNA, transcript from the sense strand in the regions corresponding to the asPer2 transcript, and rhythm in H3K4me3 at the Per2 TSS. Corresponding regions of the locus are shown in colored boxes. (E) Examples of oscillating intergenic H3K4me3 peaks and associated transcripts. Normalized H3K4me3 levels (black) and transcript tag counts from the plus strand (red) or minus strand (green) in the proximal 10 kb region at eight time points through 24h are shown.
Figure 5
Figure 5. H3K27ac defines oscillating enhancers
(A) Flowchart for identification of rhythmic H3K27ac at enhancers and promoters. (B) Histogram and heatmap rendering of various histone modifications and DNA methylation levels at enhancers. (C) Heatmap representation of oscillating H3K27ac at enhancers and promoters. (D) Heatmap representation and (E) Venn diagram of 283 oscillating enhancers and proximal (within 200kb) oscillating transcripts. (F) Difference in peak phase between RNA and enhancer H3K27ac is shown as a histogram. H3K27ac levels preceded RNA levels. (G) Synchronous histone modification rhythms correlate with improved amplitude of transcript oscillations. Average (+ s.d.) peak:trough ratio (amplitude) of oscillating transcripts with oscillating enhancer H3K27ac, promoter H3K27ac, promoter H3K4me3 or combinations of histone modification rhythms are shown. Number of transcripts that meet these criteria are shown below. (H). Gene names of 26 loci and (I) example loci with robust oscillations in RNA, promoter H3K4me3, promoter H3K27ac and enhancer H3K27ac
Figure 6
Figure 6. Enhancer H3K27ac oscillation temporally correlates with transcript oscillation from proximal gene or cluster of genes
Transcript (red/green) and H3K27ac (blue/light blue) read density is are illustrated at (A) Cry1 and (B) Insig2 loci at eight time points (rowsH3K4me3 and H3K4me1 read density is given as a reference in the bottom panel and H3K4me3 is shown as insets at each time points (black). Enhancers are indicated as blue bars and arrows indicate promoters of target genes. (C and D) Single enhancers drive transcription of multiple proximal genes. Gene models, peak phase of oscillating transcripts are shown on top. Blue horizontal bars denote enhancer regions marked by oscillating H3K27ac and absence of H3K4me3.
Figure 7
Figure 7. Synergistic role of circadian transcription regulator binding and histone modification rhythms in driving robust transcript opsillation
(A) Venn diagram and (B) heatmap rendering of Rev-erb occupancy (blue present, white absent) and oscillating transcripts at 437 loci. (C) Venn diagram and (D) heatmap showing 300 loci with rhythmic transcripts also show rhythmic binding of BMAL1.(E) Read density of REV-ERB α and β (light blue and purple) and H3K4me3 (black) are shown as histograms for the Per2, Insig2, and Rorc loci. (F) Read density of BMAL1 (ZT6) and H3K4me3 (CT6) are shown as histograms for the Dbp and Nr1d1 loci. REV-ERB α and β (light blue and purple), BMAL1 (blue), and H3K4me3 (black) are binned in 150 bp bins. (G) Mapping the binding sites of 7 different circadian regulators to expressed genes revealed propensity of their binding to genes with oscillating transcripts and oscillating promoter H3K4me3. Average (+ s.e.m.) number of binding sites at all expressed genes (n=14, 492), rhythmic transcripts (n=1262) and rhythmic transcreipt-promoter H3K4me3 pairs (n=163) are shown. (H) Mapping BMAL1 binding sites to promoter and enhancers. (I) Examples of rhythmic promoter-transcript pairs or (J) rhythmic enhancer-transcript pairs with BMAL1 occupancy at promoters or enhancers. Note at Usp2 locus promoter signature and BMAL1 occupancy coincides with an alternate TSS that defines Usp2.2 transcript variant. (K) Examples of genes with oscillating transcript and temporally correlated BMAL1 in enhancers. Normalized transcript and enhancer-H3K27ac and BMAL1 levels at eight (transcript, H3K27ac) or six (BMAL1) different time points are shown.

References

    1. Alenghat T, Meyers K, Mullican SE, Leitner K, Adeniji-Adele A, Avila J, Bucan M, Ahima RS, Kaestner KH, Lazar MA. Nuclear receptor corepressor and histone deacetylase 3 govern circadian metabolic physiology. Nature. 2008;456:997–1000. - PMC - PubMed
    1. Anzulovich A, Mir A, Brewer M, Ferreyra G, Vinson C, Baler R. Elovl3: a model gene to dissect homeostatic links between the circadian clock and nutritional status. J Lipid Res. 2006;47:2690–2700. - PubMed
    1. Asher G, Schibler U. Crosstalk between components of circadian and metabolic cycles in mammals. Cell metabolism. 2011;13:125–137. - PubMed
    1. Atwood A, DeConde R, Wang SS, Mockler TC, Sabir JS, Ideker T, Kay SA. Cell-autonomous circadian clock of hepatocytes drives rhythms in transcription and polyamine synthesis. Proc Natl Acad Sci U S A. 2011;108:18560–18565. - PMC - PubMed
    1. Bass J, Takahashi JS. Circadian integration of metabolism and energetics. Science. 2010;330:1349–1354. - PMC - PubMed

Publication types

LinkOut - more resources