

doi: 10.1016/j.jchromb.2012.10.028.
Epub 2012 Nov 2.
Ion mobility spectrometry for detection of skin volatiles
Affiliations
- PMID: 23217311
- PMCID: PMC3520010
- DOI: 10.1016/j.jchromb.2012.10.028
Item in Clipboard
Ion mobility spectrometry for detection of skin volatiles
J Chromatogr B Analyt Technol Biomed Life Sci.
.
Abstract
Volatile organic compounds (VOCs) released by humans through their skin were investigated in near real time using ion mobility spectrometry after gas chromatographic separation with a short multi-capillary column. VOCs typically found in a small nitrogen flow covering the skin are 3-methyl-2-butenal, 6-methylhept-5-en-2-one, sec-butyl acetate, benzaldehyde, octanal, 2-ethylhexanol, nonanal and decanal at volume fractions in the low part per billion-(ppb) range. The technique presented here may contribute to elucidating some physiological processes occurring in the human skin.
Copyright © 2012 Elsevier B.V. All rights reserved.
Figures

Set-up of GC–IMS. The stainless steel pan used for skin VOC sampling was tightly fixed to the navel/umbilicus of the volunteer using a bandage. The pan was rinsed with nitrogen flow (3 ml/min) and its outlet was directly connected to the sample loop integrated in the GC–IMS device.
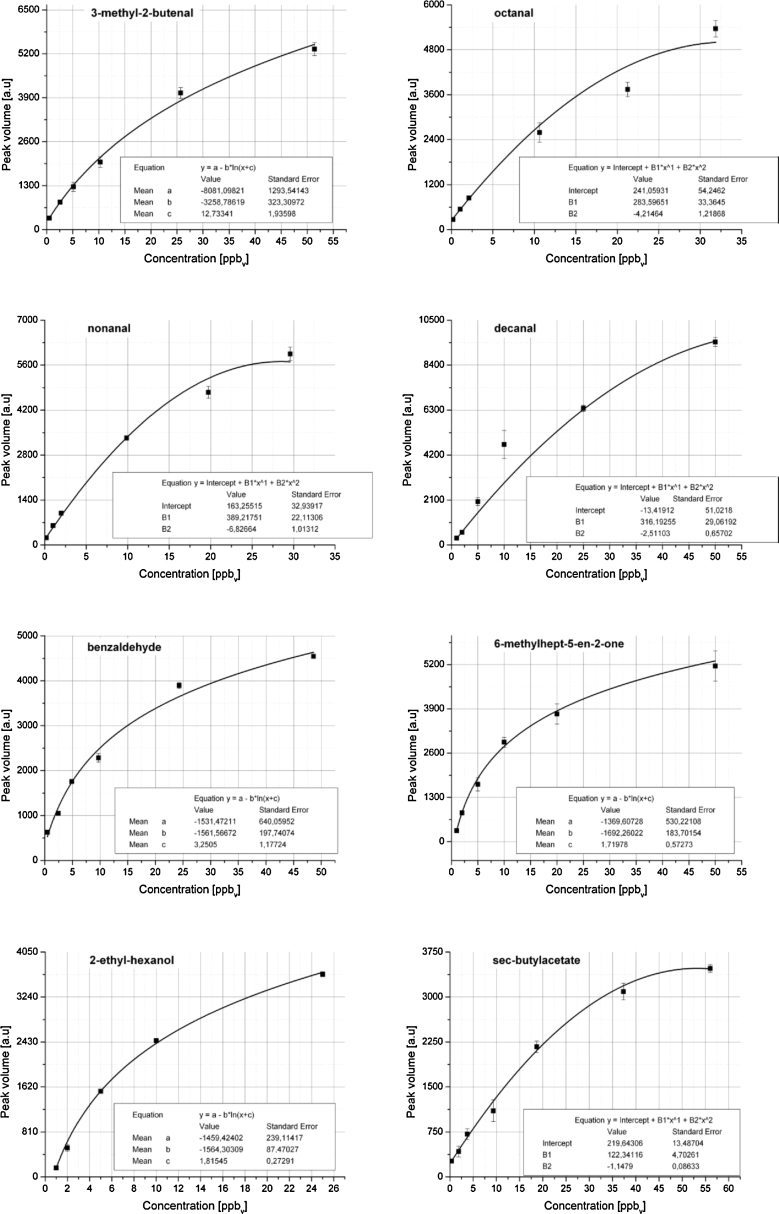
(a–h) Calibration curves of the selected compounds measured with GC–IMS.

3D-visualization of IMS-chromatogram of emitted skin VOCs. Drift time and retention time are presented in X- and Y-axis, respectively, and peak height is displayed using colour-scale.

(a and b) Concentration profile of octanal and nonanal detected in gas samples collected above skin.
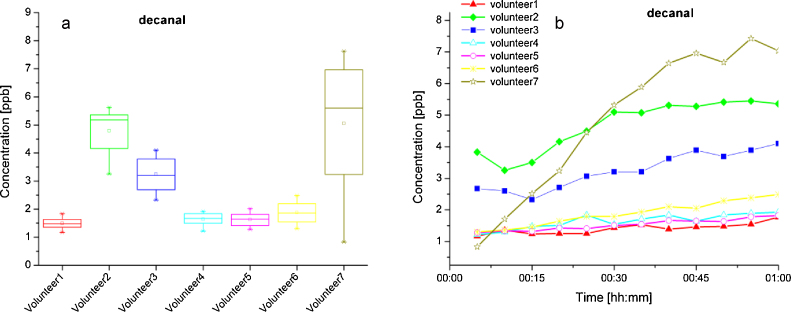
(a) Concentration profile of decanal detected in skin samples of seven volunteers; (b) increasing emitted concentration values for decanal during skin experiments.

(a and b) Concentration profile of 3-methyl-2-butenal and benzaldehyde detected in skin gas samples.
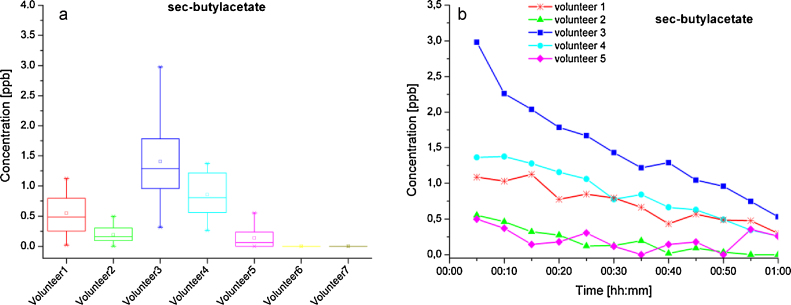
(a) Concentration profile of sec-butylacetate detected in gas samples collected above skin; (b) decrease of sec-butylacetate concentration during skin measurements.

(a and b) Concentration profile of 2-ethyl-hexanol and 6-methylhept-5-en-2-one detected in skin samples.
References
-
- Smith K.R., Thiboutot D.M. J. Lipid Res. 2008;49:271. - PubMed
-
- Gurr M.I. Blackwell Science Ltd; Oxford: 2002. Lipid Biochemistry.
-
- Jezierski T., Sobczynska M., Walczak M., Gorecka-Bruzda A., Ensminger J. J. Forensic Sci. 2012 - PubMed
-
- Mochalski P., Agapiou A., Statheropoulos M., Amann A. Analyst. 2012;137:3278. - PubMed
Publication types
MeSH terms
Substances
Grants and funding
LinkOut - more resources
Full Text Sources
Other Literature Sources
Research Materials
