

Improved heritability estimation from genome-wide SNPs
- PMID: 23217325
- PMCID: PMC3516604
- DOI: 10.1016/j.ajhg.2012.10.010
Improved heritability estimation from genome-wide SNPs
Abstract
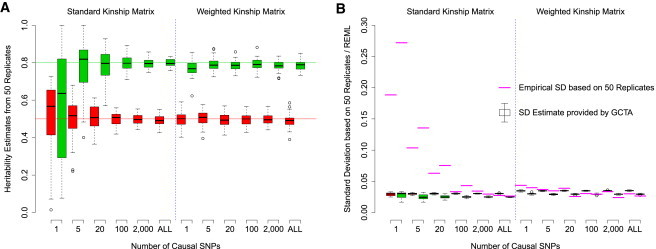
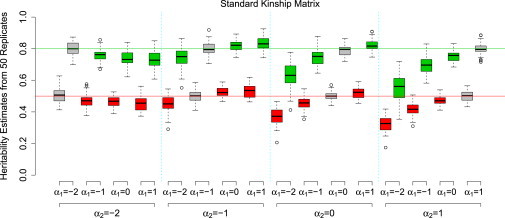
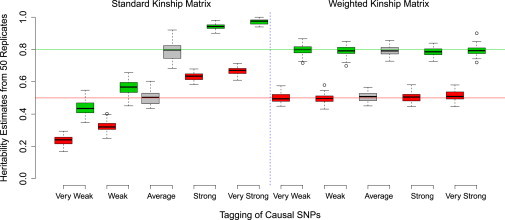
Estimation of narrow-sense heritability, h(2), from genome-wide SNPs genotyped in unrelated individuals has recently attracted interest and offers several advantages over traditional pedigree-based methods. With the use of this approach, it has been estimated that over half the heritability of human height can be attributed to the ~300,000 SNPs on a genome-wide genotyping array. In comparison, only 5%-10% can be explained by SNPs reaching genome-wide significance. We investigated via simulation the validity of several key assumptions underpinning the mixed-model analysis used in SNP-based h(2) estimation. Although we found that the method is reasonably robust to violations of four key assumptions, it can be highly sensitive to uneven linkage disequilibrium (LD) between SNPs: contributions to h(2) are overestimated from causal variants in regions of high LD and are underestimated in regions of low LD. The overall direction of the bias can be up or down depending on the genetic architecture of the trait, but it can be substantial in realistic scenarios. We propose a modified kinship matrix in which SNPs are weighted according to local LD. We show that this correction greatly reduces the bias and increases the precision of h(2) estimates. We demonstrate the impact of our method on the first seven diseases studied by the Wellcome Trust Case Control Consortium. Our LD adjustment revises downward the h(2) estimate for immune-related diseases, as expected because of high LD in the major-histocompatibility region, but increases it for some nonimmune diseases. To calculate our revised kinship matrix, we developed LDAK, software for computing LD-adjusted kinships.
Copyright © 2012 The American Society of Human Genetics. Published by Elsevier Inc. All rights reserved.
Figures
Comment in
-
Estimation of SNP heritability from dense genotype data.Am J Hum Genet. 2013 Dec 5;93(6):1151-5. doi: 10.1016/j.ajhg.2013.10.015. Am J Hum Genet. 2013. PMID: 24314550 Free PMC article. No abstract available.
-
Response to Lee et al.: SNP-based heritability analysis with dense data.Am J Hum Genet. 2013 Dec 5;93(6):1155-7. doi: 10.1016/j.ajhg.2013.10.016. Am J Hum Genet. 2013. PMID: 24314551 Free PMC article. No abstract available.
References
-
- Henderson C., Kempthorne O., Searle S., von Krosigk C. The estimation of environmental and genetic trends from records subject to culling. Biometrics. 1959;15:192–218.
-
- Hartley H.O., Rao J.N. Maximum-likelihood estimation for the mixed analysis of variance model. Biometrika. 1967;54:93–108. - PubMed
-
- Robinson G. That BLUP is a good thing: The estimation of random effects. Stat. Sci. 1991;6:15–51.
-
- Astle W., Balding D. Population structure and cryptic relatedness in genetic association studies. Stat. Sci. 2009;24:451–471.
Publication types
MeSH terms
Grants and funding
LinkOut - more resources
Full Text Sources
Other Literature Sources
Research Materials
