. 2012 Dec 7;151(6):1185-99.
doi: 10.1016/j.cell.2012.10.047.

The histone deacetylase SIRT6 is a tumor suppressor that controls cancer metabolism

Affiliations

The histone deacetylase SIRT6 is a tumor suppressor that controls cancer metabolism

Carlos Sebastián et al. Cell. .

Abstract

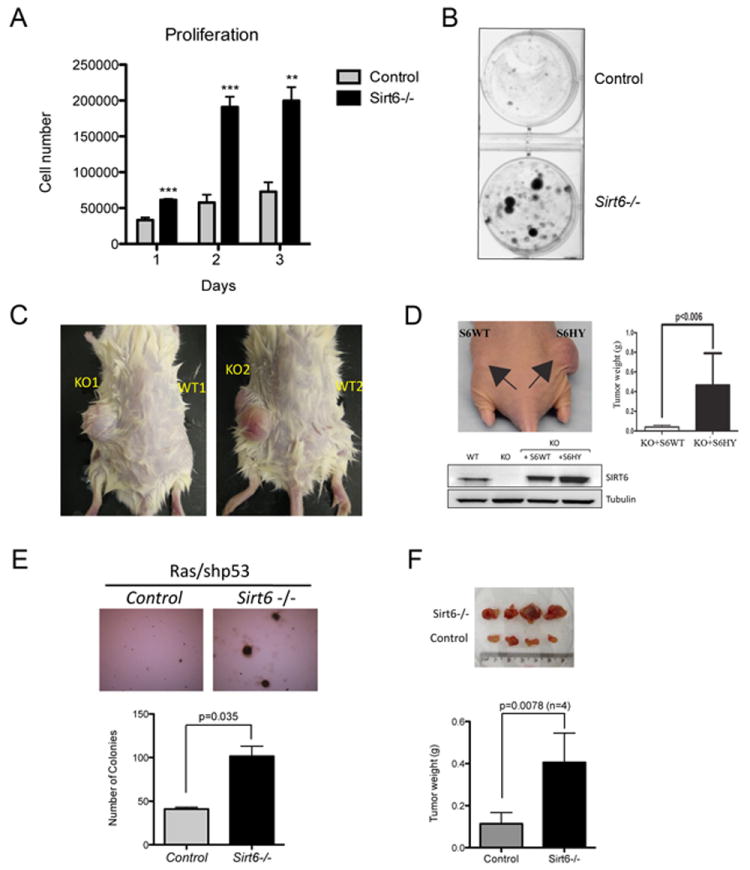
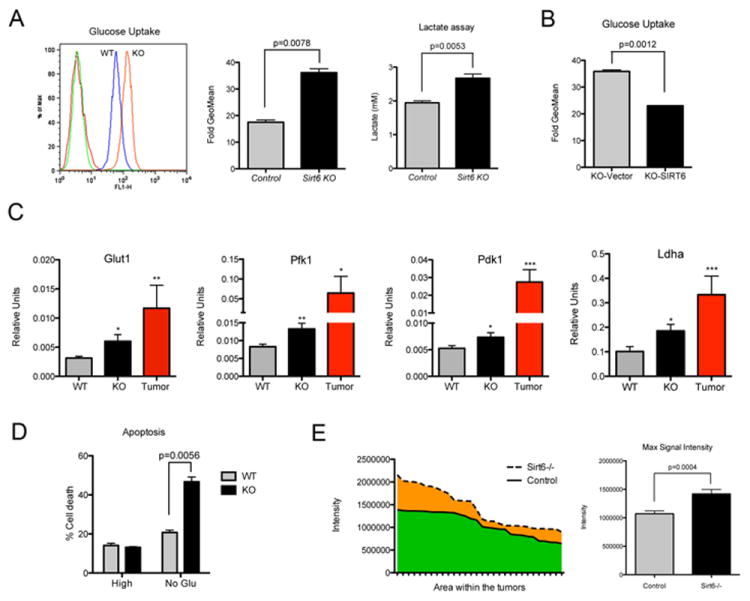
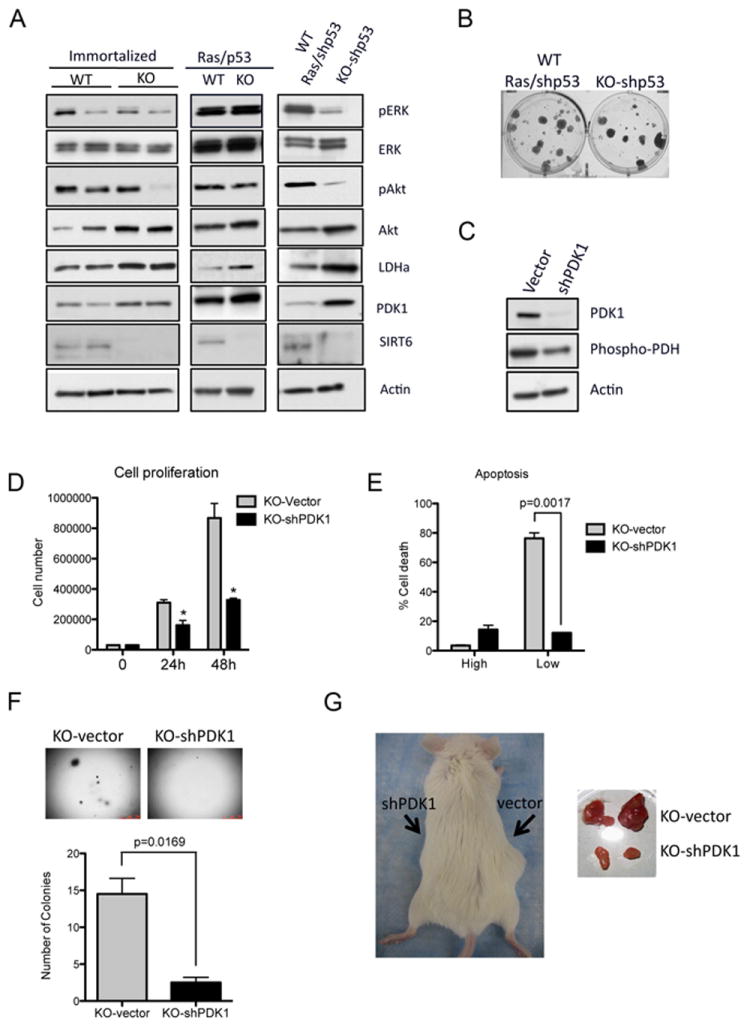
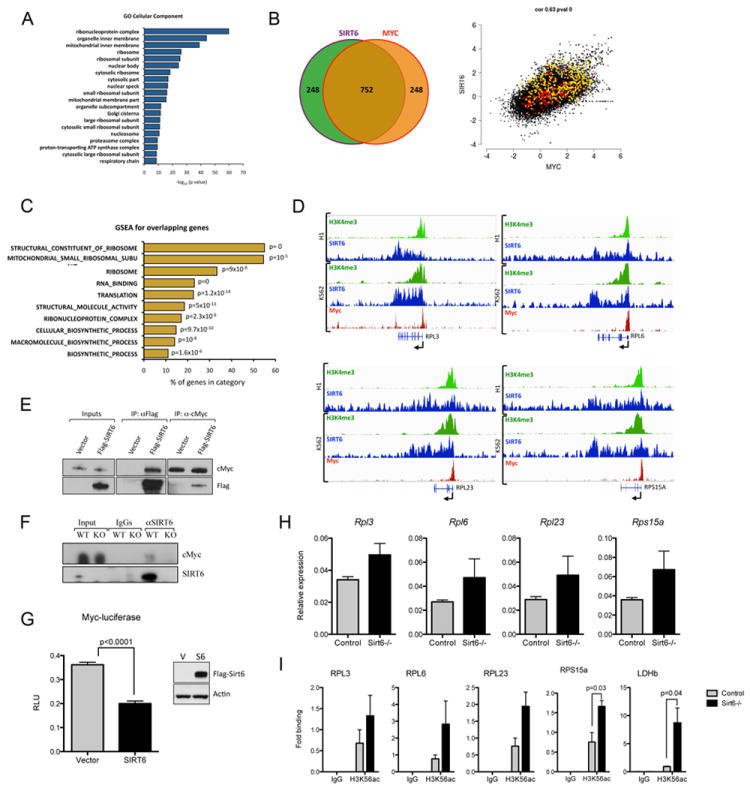
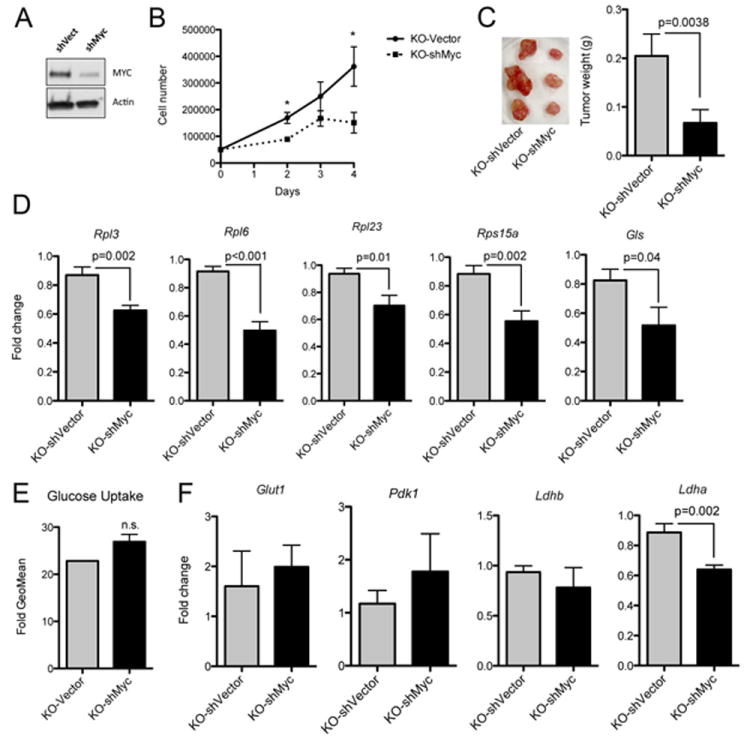
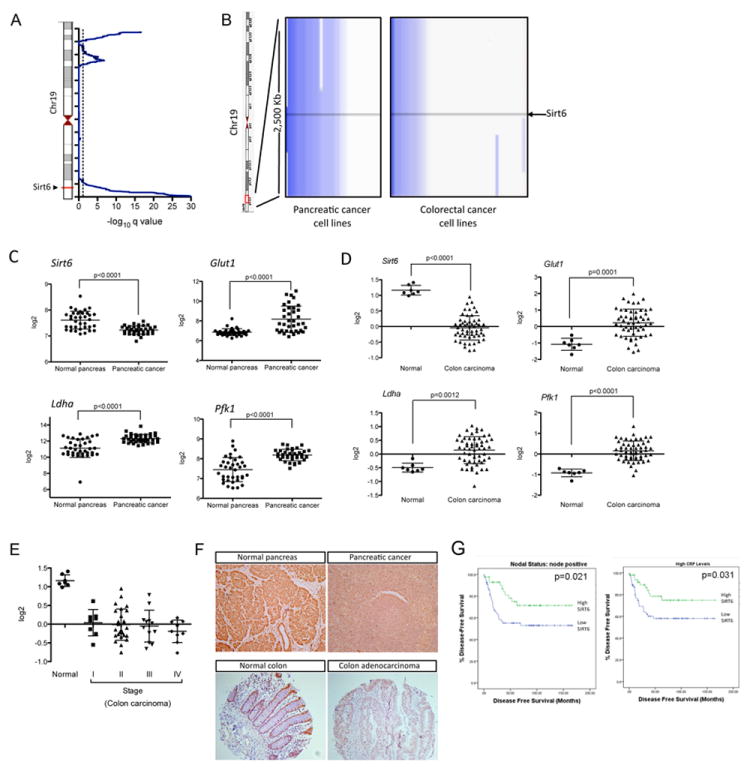
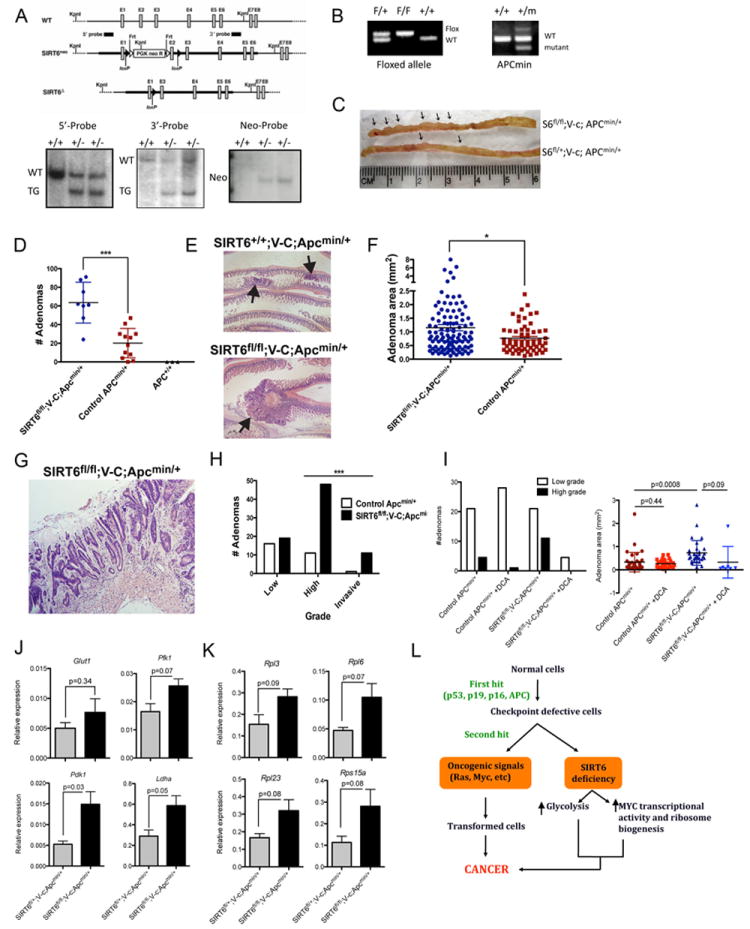
Reprogramming of cellular metabolism is a key event during tumorigenesis. Despite being known for decades (Warburg effect), the molecular mechanisms regulating this switch remained unexplored. Here, we identify SIRT6 as a tumor suppressor that regulates aerobic glycolysis in cancer cells. Importantly, loss of SIRT6 leads to tumor formation without activation of known oncogenes, whereas transformed SIRT6-deficient cells display increased glycolysis and tumor growth, suggesting that SIRT6 plays a role in both establishment and maintenance of cancer. By using a conditional SIRT6 allele, we show that SIRT6 deletion in vivo increases the number, size, and aggressiveness of tumors. SIRT6 also functions as a regulator of ribosome metabolism by corepressing MYC transcriptional activity. Lastly, Sirt6 is selectively downregulated in several human cancers, and expression levels of SIRT6 predict prognosis and tumor-free survival rates, highlighting SIRT6 as a critical modulator of cancer metabolism. Our studies reveal SIRT6 to be a potent tumor suppressor acting to suppress cancer metabolism.


Figures

Figure 1
Figure 1. SIRT6 deficient cells are tumorigenic
A) Sirt6 WT and Sirt6 KO immortalized MEFs (two independent cell lines for each) were plated and cells counted at the indicated times. Errors bars indicate SEM. B) Sirt6 WT and KO cells were plated at very low confluency and assayed for colony formation. C) Two independent immortalized cell lines of the indicated genotypes were injected into the flanks of SCID mice to assess their tumorigenic potential. D) Sirt6 KO immortalized MEFs were transduced with lentiviruses encoding Flag-SIRT6 (WT and HY) and assayed for in vivo tumor formation as in C. E) Anchorage-independent cell growth of Sirt6 WT and KO H-RasV12/shp53 transformed MEFs (error bars indicate SD). F) The same cells as in D were injected into the flanks of SCID mice (n=4) and the tumors harvested and weighted (error bars indicate SD). See also Figure S1.
Figure 2
Figure 2. SIRT6 deficient cells and tumors exhibit enhanced aerobic glycolysis
A) Glucose uptake (left and middle panels) and lactate production (right panel) of Sirt6 WT and Sirt6 KO immortalized MEFs (two independent cell lines, error bars indicate SEM). B) Glucose uptake of Sirt6 KO immortalized MEFs transduced with either an empty vector or a plasmid encoding for Flag-SIRT6 (error bars indicate SD). C) Real-Time PCR showing the expression of the indicated genes in Sirt6 WT and Sirt6 KO (n=20 experiments from two independent lines) immortalized MEFs and in the cells derived from Sirt6 KO tumors (n=8 experiments from three independent lines) (error bars indicate SEM). D) The same cells as in A were cultured with or without glucose for 6 days and cell death assayed by AnnexinV staining (error bars indicate SEM). E) 18FDG-Glucose uptake in Sirt6 WT and KO H-RasV12/shp53 tumors. Left panel shows FDG-PET intensity of the 5 sections of each tumor (total of 6 tumors for each genotype) showing the highest intensity. Right panel shows the average of 30 FDG-PET signals (6 tumors, 5 sections per tumor) for the indicated genotypes (error bars indicate SD). See also Figure S2.
Figure 3
Figure 3. Oncogene-independent, glycolysis-dependent transformation of SIRT6 deficient cells
A) Western blots showing the activation of ERK and AKT pathways as well as PDK1 and LDHa expression in Sirt6 WT and KO immortalized and transformed MEFs. B) Colony formation assay with the indicated cell lines. C) Western blot of PDK expression and PDH-E1a-Ser293 phosphorylation in Sirt6 KO-shPDK1 cells D) Cell proliferation of Sirt6 KO-shVector and Sirt6 KO-shPDK1 (error bars indicate SD). E) Glucose starvation-induced cell death of Sirt6 KO-shVector and Sirt6 KO-shPDK1 cells (error bars indicate SD). F) Anchorage-independent cell growth of the same cells as in E (error bars indicate SD). F) The same cells as in F were injected into the flanks of SCID mice (n=2) and the tumors harvested and photographed. See also Figure S3.
Figure 4
Figure 4. SIRT6 inhibits ribosomal gene expression by co-repressing MYC transcriptional activity
A) Gene Ontology clustering of SIRT6-bound promoters B) Overlapping of the top 1000 SIRT6- and MYC-bound promoters. C) Gene Set Enrichment Analysis for the overlapping genes described in B. D) H3K4me3, SIRT6 and MYC ChIP signal in the indicated genomic regions in K562 cells and human ES cells (H1). E) Flag-SIRT6 and cMYC IPs showing physical interaction between SIRT6 and MYC. F) Endogenous SIRT6 was immunoprecipitated and the interaction with MYC analyzed by western blot. F) A luciferase reporter gene under the regulation of a MYC-responsive element was contrasfected with empty vector or Flag-SIRT6 plasmids in 293T cells and luciferase expression analyzed 24h later (error bars indicate SEM). G) Expression of the indicated genes in Sirt6 WT and KO H-RasV12/shp53 tumors (n=4) (error bars indicate SEM). I) ChIP analysis of H3K56 acetylation levels in Sirt6 WT and KO H-RasV12/shp53 MEFs (n=4, error bars indicate SEM). See also Figure S4 and Table S1.
Figure 5
Figure 5. MYC regulates tumor growth of SIRT6-deficient cells
A) Western blot showing MYC levels in Sirt6 KO-shVector and shMYC cells. B) 5×10⁵ MEFs were plated in triplicate and cells counted at the indicated time points (error bars indicate SD). C) 5×10⁶ cells of the indicated genotypes were injected into SCID mice and the tumors harvested and weighted (error bars indicate SD). D) Expression of the indicated genes in Sirt6 KO-shVector and KO-shMYC cells (n=9) (error bars indicate SEM). E) Glucose uptake was analyzed in the same cells as in A (error bars indicate SD). F) The same samples as in D were used to analyze the expression of the indicated genes (error bars indicate SEM). See also Figure S5.
Figure 6
Figure 6. SIRT6 expression is downregulated in human cancers
A) Analysis of gene copy number loss in chromosome 19. Blue line indicates deletion significance (-log10(q value), 0.6 –dotted line- is the significance threshold for deletion). SIRT6 location within the chromosome is indicated. B) SIRT6 copy number data for pancreatic (left graph, n=40) and colorectal (right graph, n=51) cancer cell lines. Color bars indicate degree of copy number loss (blue) or gain (red). C) Gene expression of the indicated genes in human pancreatic cancer (GEO dataset GSE15471). D) Gene expression of the indicated genes in human colon carcinoma (GEO dataset GSE31905). E) SIRT6 expression in the same colon carcinoma dataset as D but classified by stage. F) IHC showing SIRT6 expression in pancreatic cancer and colon adenocarcinoma compared to normal tissue. G) Kaplan-Meier curves showing disease free survival rates in patients with node positive tumors (left) or high CRP serum levels (right) with high and low levels of nuclear SIRT6. See also Figure S6.
Figure 7
Figure 7. SIRT6 functions as a tumor suppressor in vivo
A) Strategy to target the SIRT6 locus (upper panel). Southern blot (5’, 3’ and Neo probes) of KpnI-digested genomic DNA showing the targeted allele in the heterozygous cells (+/-) (lower panels). B) PCR showing the presence of the SIRT6 floxed allele (left) and the mutant APC allele (right). C) Representative image of a intestine section from SIRT6fl/fl;V-c;APCmin/+ and SIRT6fl/+;V-c;APCmin/+ mice. Arrows indicate the presence of polyps. D) Adenoma number in the intestines of mice of the indicated genotype. E) H&E staining showing the adenoma size in the indicated mice. F) Adenoma area in SIRT6fl/fl;V-c;APCmin/+ and Control;APCmin/+ mice. G) Representative image and (H) quantification of the grade of the tumors in the indicated mice. I) Grade (righ panel) and area (left panel) of the adenomas in SIRT6fl/fl;V-c;APCmin/+ and Control;APCmin/+ mice untreated or treated with DCA (5g/L). J) and K) Expression of several glycolytic and ribosomal genes in adenomas (n=3) of SIRT6fl/fl;V-c;APCmin/+ and SIRT6fl/+;V-c;APCmin/+ mice (error bars indicate SEM). See also Figure S7.

Comment in

References

    1. Anders M, Fehlker M, Wang Q, Wissmann C, Pilarsky C, Kemmner W, Hocker M. Microarray meta-analysis defines global angiogenesis-related gene expression signatures in human carcinomas. Mol Carcinog 2011 - PubMed
    1. Arabi A, Wu S, Ridderstrale K, Bierhoff H, Shiue C, Fatyol K, Fahlen S, Hydbring P, Soderberg O, Grummt I, et al. c-Myc associates with ribosomal DNA and activates RNA polymerase I transcription. Nat Cell Biol. 2005;7:303–310. - PubMed
    1. Badea L, Herlea V, Dima SO, Dumitrascu T, Popescu I. Combined gene expression analysis of whole-tissue and microdissected pancreatic ductal adenocarcinoma identifies genes specifically overexpressed in tumor epithelia. Hepatogastroenterology. 2008;55:2016–2027. - PubMed
    1. Barna M, Pusic A, Zollo O, Costa M, Kondrashov N, Rego E, Rao PH, Ruggero D. Suppression of Myc oncogenic activity by ribosomal protein haploinsufficiency. Nature. 2008;456:971–975. - PMC - PubMed
    1. Barretina J, Caponigro G, Stransky N, Venkatesan K, Margolin AA, Kim S, Wilson CJ, Lehar J, Kryukov GV, Sonkin D, et al. The Cancer Cell Line Encyclopedia enables predictive modelling of anticancer drug sensitivity. Nature. 2012;483:603–607. - PMC - PubMed

Publication types