. 2012 Dec 7;151(6):1370-85.
doi: 10.1016/j.cell.2012.10.008.

Noninvasive imaging beyond the diffraction limit of 3D dynamics in thickly fluorescent specimens

Affiliations

Noninvasive imaging beyond the diffraction limit of 3D dynamics in thickly fluorescent specimens

Liang Gao et al. Cell. .

Abstract

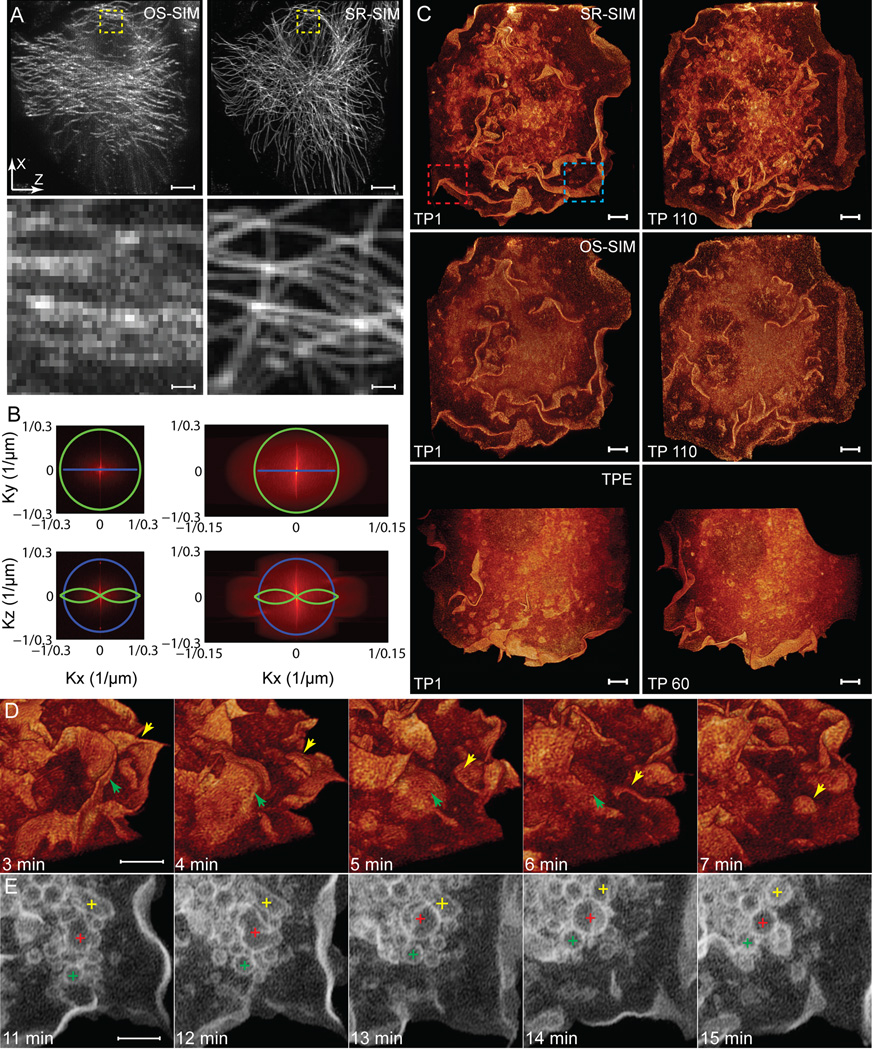
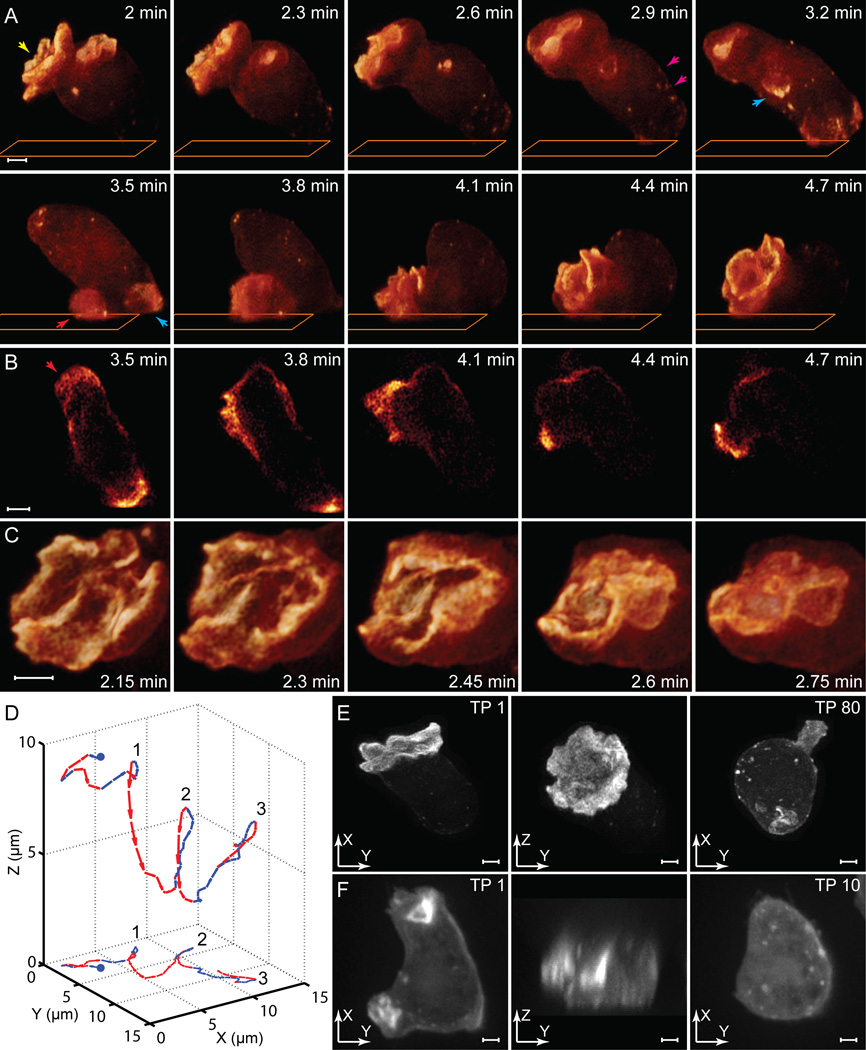
Optical imaging of the dynamics of living specimens involves tradeoffs between spatial resolution, temporal resolution, and phototoxicity, made more difficult in three dimensions. Here, however, we report that rapid three-dimensional (3D) dynamics can be studied beyond the diffraction limit in thick or densely fluorescent living specimens over many time points by combining ultrathin planar illumination produced by scanned Bessel beams with super-resolution structured illumination microscopy. We demonstrate in vivo karyotyping of chromosomes during mitosis and identify different dynamics for the actin cytoskeleton at the dorsal and ventral surfaces of fibroblasts. Compared to spinning disk confocal microscopy, we demonstrate substantially reduced photodamage when imaging rapid morphological changes in D. discoideum cells, as well as improved contrast and resolution at depth within developing C. elegans embryos. Bessel beam structured plane illumination thus promises new insights into complex biological phenomena that require 4D subcellular spatiotemporal detail in either a single or multicellular context.


Figures

Figure 1
Figure 1. Bessel Beam Superresolution Structured Plane illumination Microscopy Improves Signal, Contrast, and Spatial Resolution During the 3D Imaging of Cellular Dynamics
(A) Top: Maximum intensity projection of the same 3D data set of microtubules in a fixed LLC-PK1 cell, as analyzed by Bessel plane OS-SIM (left, Planchon et al., 2011) and Bessel plane SR-SIM (right). Bottom: Zoom images of the boxed regions in A. (B) Frequency space representations of the same data, showing that Bessel plane SR-SIM (right) contains information (red) beyond the diffraction limits of the excitation (blue) and detection (green) objectives in two directions (x and z). (C) Volume renderings of live COS-7 cells expressing mEmerald/c-Src, which promotes membrane ruffles and the formation of internal vacuoles. Top: Bessel plane SR-SIM; Middle: Bessel plane OS-SIM analysis of the same data; Bottom: Two-photon Bessel beam plane illumination, showing cell retraction (right, Planchon et al., 2011) after only 60 image volumes. (D) Progression of macropinocytosis, as two membrane ruffles (green and yellow arrows) fold over and encapsulate extracellular fluid to form internal vesicles. From the red boxed region in C. (E) Trafficking of vesicles (colored crosses) at five time points from a series of 110 volumes acquired at 20 sec intervals. From the blue boxed region in C. Scale bars: 5 µm and 0.5 µm in A; 5 µm in C, D, and E. See also Movie S1.
Figure 2
Figure 2. Differing Cytoskeletal Dynamics at the Dorsal and Ventral Membranes Revealed by Bessel Plane SR-SIM
(A) Oblique view volume rendering of a live fox lung cell expressing mEmerald/actin, from a series of 96 such volumes recorded at 30 sec intervals. (B) Internal view at four time points through the yellow cut plane in A. Actin stress fibers at the ventral surface are stationary (magneta arrows), while those at the dorsal membrane flow inwards (green, yellow arrows), before detaching and depolymerizing within the cytosol. See also Movie S2. (C) Volume rendering of actin in a live U2OS cell, from a series of 30 volumes at 30 sec intervals. (D,E) Internal views through the yellow cut line in C, showing that detached stress fibers (yellow arrows) are straight, and thus presumably under considerable tension. (F) Internal view through the blue cut line in C, showing that curved stress fibers (blue arrow) are attached to the dorsal membrane. Scale bars: 5 µm in B, C; 2 µm in D–F.
Figure 3
Figure 3. Bessel Plane SR-SIM Outperforms Widefield 3D SR-SIM in Densely Fluorescent or Thick Specimens
(A) Three orthogonal maximum intensity projections of chromosomes in a live LLC-PK1 cell in anaphase, as seen by Bessel plane SR-SIM. (B) Similar views in another live LLC-PK1 cell in anaphase, as seenby widefield 3D SR-SIM (C) Lateral (left) and axial (right) maximum intensity projection views of a living early stage C. elegans embryo, as seen by Bessel plane SR-SIM. (D) Similar views in another living C. elegans embryo, as seen by widefield 3D SR-SIM. Scale bars: 2 µm in A, B; 5 µm in C, D.
Figure 4
Figure 4. 3D Actin Flow, Membrane Remodeling, and Motility in D. discoideum
(A) Volume renderings at ten time points extracted from a series of 80 volumes recorded by Bessel plane SR-SIM, showing actin flowing from the distal to the proximal end of the cell, and crown shaped protrusions both collapsing (yellow arrow) and growing (red arrow). (B) 2D slices taken from the data near the cover slip plane (orange rectangle in A). (C) Expanded view at 9 sec intervals of the collapsing crown-shaped protrusion in A. (D) 3D map (top) of the center of fluorescence intensity over all 80 time points, showing repeated cycles of motion toward (red) and away from (blue) the cover slip, with lateral motility (bottom 2D projection) correlated to the downward rush of actin. (E) Lateral (left) and axial (middle) maximum intensity projections at the first time point, and lateral view at the 80th time point (right). Rapid protrusive motion is still observed, indicative of cell health. (F) Similar views for another D. discoideum ameboid, taken with spinning disk confocal microscopy, showing slightly poorer lateral (left) and substantially poorer axial (center) resolution. After the 10th time point (right), the cell is sessile and round in shape, indicative of cell damage. Scale bars: 2 µm. See also Movie S3.
Figure 5
Figure 5. In Vivo Karyotyping of a Mitotic U2OS Cell
(A) Dual color imaging of chromosomes (green) and kinetochores (red) at six different time points from prometaphase to metaphase, taken from a series of 50 volumes acquired at 60 sec intervals. Three specific chromosomes (colored magenta, brown, and yellow) were identified by shape and tracked at all times. (B) In vivo karyotyping by manual segmentation of all chromosomes at the initial time point. In each case, kinetochore pairs are shown correctly co-localized with their corresponding chromatids, and can be used to help identify specific chromosomes. The cell exhibits extreme polyploidy, with 76 diploids and one possible triploid (red arrow). Scale bars: 5 µm in A; 2 µm in B. See also Movie S4.
Figure 6
Figure 6. 3D Development in C.elegans Embryos
(A) Live embryo at the 12 cell stage, from a series of 31 volumes recorded at 1.1 min intervals from the 8 to 23 cell stage, as seen using a GFP membrane marker. (B) Expanded view from within the box in A, showing, at four time points, the evolution of a membrane protrusion from the ABprp cell over the surface of the neighboring E cell. (C) Another live embryo, at the 8 cell stage, expressing both GFP/myosin (green) and a mCherry membrane marker (orange). (D) Expanded view from within the box in C, showing the contractile cytokinetic ring between two dividing AB-derived cells. (E) Cross sectional view in the plane of the contractile ring from D. (F) Lateral maximum intensity projection (left) and single axial slice (right, from along the green line at left) of a live embryo seen by Bessel plane SR-SIM. (G) Similar views for an embryo at a similar stage, as seen by spinning disk confocal microscopy, showing rapid loss of signal and resolution at depth. (H) Comparative photobleaching rates for Bessel plane SR-SIM and spinning disk confocal microscopy in early embryos. Bleaching is reduced ~2× in the Bessel case, even though twice as many image planes are acquired per time point to achieve higher axial resolution, and even though the time interval between 3D stacks is three fold faster. Scale bars: 5 µm (A, C, F, G), 2 µm (B,D,E). See also Movie S5.
Figure 7
Figure 7. Two-Photon Bessel Beam Plane SR-SIM of Larger Multicellular Specimens
(A) Chromosomes in mitotic nuclei at the surface of a D. melanogaster embryo. (B) Zoom view of the boxed chromosome in A, with chromatids individually colored. (C) Sex chromosomes isolated from B, identifying the embryo as female. (D, E, F) Autosomes 2, 3, and 4 isolated from B. (G) Lateral and axial maximum intensity projections by Bessel plane SR-SIM. (H) Similar views of chromosomes at a similar stage, from another embryo as viewed by multibeam confocal microscopy. (I) Stochastically labeled subset of neurons within the lobula plate of the optic lobe of a brain extracted from an adult D. melanogaster, including the HSN (blue arrow) and VS2 (green arrow) giant neurons. (J, K) Dendrites within the box in I, viewed from different angles. (L) Cross-sectional view of dendrites at the cut plane in J, showing the ability to resolve the intracellular space. (M) All nuclei within a fixed L1 stage C. elegans larva. (N) View into the mouth of the nematode. (O) Zoom in view of the blue box in M. (P) Cross section through nuclei at the cut plane in O. Scale bars: 5 µm in A; 1 µm in B–H, L; 10 µm in I, M; 2 µm in J, K, N, O, P. See also Movie S6.

References

    1. Betzig E, Patterson GH, Sougrat R, Lindwasser OW, Olenych S, Bonifacino JS, Davidson MW, Lippincott-Schwartz J, Hess HF. Imaging intracellular fluorescent proteins at nanometer resolution. Science. 2006;313:1642–1645. - PubMed
    1. Booth MJ. Adaptive optics in microscopy. Phil. Trans. R. Soc. Lond. Ser. A. 2007;365:2829–2843. - PubMed
    1. Burnette DT, Manley S, Sengupta P, Sougrat R, Davidson MW, Kachar B, Lippincott-Schwartz J. Nat. Cell Biol. 2011;13:371–381. - PMC - PubMed
    1. Cella Zanachhi F, Lavagnino Z, Perrone Donnorso M, Del Bue A, Furia L, Faretta M, Diaspro A. Live-cell 3D super-resolution imaging in thick biological samples. Nat. Meth. 2011;8:1047–1049. - PubMed
    1. Dupuy D, Bertin N, Hidalgo CA, Venkatesan K, Tu D, Lee D, Rosenberg J, Svrzikapa N, Blanc A, Carnec A, Carvunis A-R, Pulak R, Shingles J, Reece-Hoyes J, Hunt-Newbury R, Viveiros R, Mohler WA, Tasan M, Roth FP, Le Peuch C, Hope IA, Johnsen R, Moerman DG, Barabasi A-L, Baillie D, Vidal M. Genome-scale analysis of in vivo spatiotemporal promoter activity in Caenorhabditis elegans. Nat. Biotech. 2007;25:663–668. - PubMed

Publication types