. 2012 Dec 6;76(5):976-88.
doi: 10.1016/j.neuron.2012.10.039.

Single neuron activity and theta modulation in postrhinal cortex during visual object discrimination

Affiliations

Single neuron activity and theta modulation in postrhinal cortex during visual object discrimination

Sharon C Furtak et al. Neuron. .

Abstract

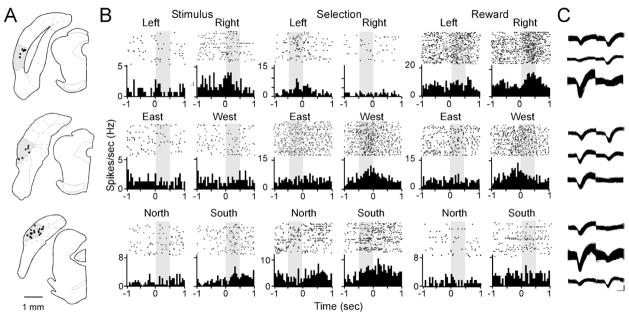
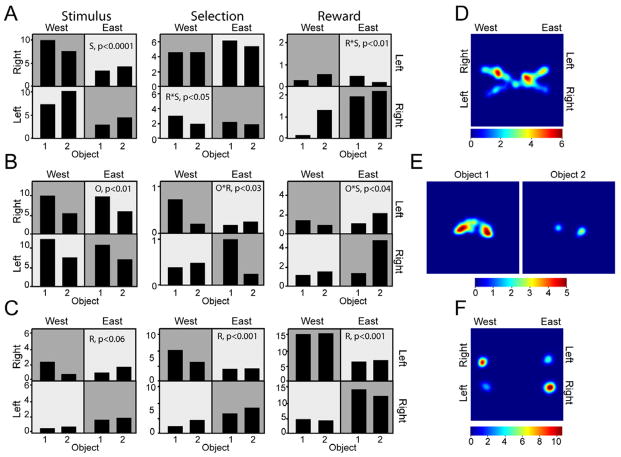
Postrhinal cortex, rodent homolog of the primate parahippocampal cortex, processes spatial and contextual information. Our hypothesis of postrhinal function is that it serves to encode context, in part, by forming representations that link objects to places. To test this hypothesis, we recorded postrhinal neurons and local field potentials (LFPs) in rats trained on a two-choice, visual discrimination task. As predicted, many postrhinal neurons signaled object-location conjunctions. Another large proportion encoded egocentric motor responses. In addition, postrhinal LFPs exhibited strong oscillatory rhythms in the theta band, and many postrhinal neurons were phase locked to theta. Although correlated with running speed, theta power was lower than predicted by speed alone immediately before and after choice. However, theta power was significantly increased following incorrect decisions, suggesting a role in signaling error. These findings provide evidence that postrhinal cortex encodes representations that link objects to places and suggest postrhinal theta modulation extends to cognitive as well as spatial functions.


Conflict of interest statement

Conflicts of Interest: No conflicts of interest.

Figures

Figure 1
Figure 1
Behavioral task. A. Schematic of Floor Projection Maze with images back-projected by a mirror. B. Top down view of an animal in the maze. A food port was located behind each of the four stimulus presentation areas. C. Pathways for a rat during shaping (left) and training (right). D. The two discrimination problems. E. Sequence of trials and analysis epochs. Trials alternated from east to west. An east trial was initiated when the rat was in the west food port area. The rat then moved to the ready position, facing east to wait for stimulus presentation. A choice was made by approaching a stimulus. Food was delivered at the port behind the correct stimulus. Presence in the east food area initiated a west trial, and so forth. Analysis epochs (500 msec) are indicated by grey blocks. See Table S1 for details of shaping procedures.
Figure 2
Figure 2
Histology and examples of neuronal correlates. A. Location of stereotrode tips in coronal sections of POR (shown in grey) between −7.70 to −8.80 mm relative to bregma. B. Example behavioral correlates of postrhinal cells during the stimulus (left), selection (center), and reward (right) epochs. Raster plots and peri-event histograms are shown for representative examples of cells with task-related firing patterns. For the stimulus epoch, time 0 is stimulus onset. For the selection and reward epochs, time 0 is choice. The upper row shows cells that fired more during left or right responses for correct trials. Examples of cells with spatial selectivity are shown in the middle and bottom rows. C. Waveforms for the isolated cells shown in B. For each row, the upper, middle, and lower waveforms correspond to the left, center, and right histograms and rastergrams. Time bins = 0.05 s, scale bar = 250 us, 100 μV.
Figure 3
Figure 3
Histograms and spatial plots for cells selective for location, object, and response. A–C. The left, center, and right histograms are from the stimulus, selection, and reward epochs, respectively, for correct trials. Firing rate is plotted as a function of location (east or west), response (left shown in light grey, right shown in dark grey), and object (1 vs. 2). P-values are inset for each example. A. Location correlates. The left cell was selective for side (S) and fired more during west trials. The center cell showed response x side (R*S) selectivity such that it fired more in the north, i.e. for right responses in the west and for left responses in the east (see also D). The right cell also exhibited R*S selectivity such that it fired more to right responses in the east. B. Object (O) and object-location conjunctions. The left cell fired more to object 1 than 2 overall (see also E). The center cell showed an object x response (O*R) selectivity such that it fired more to object 1 for right responses. The cell on the right exhibited object x side (O*S) selectivity such that it fired significantly more to object 2 in the east. C. Response (R) selectivity emerging across epochs (see also F). This cell most likely correlates with an egocentric right response. D–F. Spatial firing rate maps for representative cells. D. Location selective cell (same as A, center) that fires more in the north during the selection epoch when animals have left the ready position and are approaching the object on the west right or east left. E. Object selective cell (same as B, left) that fires more for object 1 than object 2 during the stimulus epoch when animals are just leaving the ready position near the center of the maze. F. Response selective cell (same as C, right) fires more to right responses during the reward epoch when the animal is at the reward location.
Figure 4
Figure 4
Increased theta power in POR. Examples are from three representative LFPs from three different animals (left, center, and right panels, respectively). A. Power spectra showed increased power in the theta band in 88% of the LFPs. B. Event related analysis showing higher power in the theta band for the three task relevant epochs prior to choice as compared to the reward epoch in 90% of LFPs.
Figure 5
Figure 5
Theta power and running speed. A. Event-triggered running speed for all trials for the ready (red), stimulus (orange), selection (green), and reward (blue) epochs for the same three animals and LFP sessions shown in Figure 4. B. Theta (upper) and running speed (lower) during periods when an animal was moving at high speed (left) and low speed (right). Theta power increases at faster running speeds. C. Running speed vs. average normalized theta power for all LFPs. The overall speed-theta relationship is shown in grey. To calculate this overall relationship, each session was binned into 250 ms time bins and the mean speed and mean theta power was computed for each bin. Data were then grouped by speed and the mean theta power was computed at each speed. Although running speed was correlated with theta power, overall, power in the theta band was lower than would be expected based on running speed alone for the selection (green) and reward (blue) epochs. See also Supplemental Text.
Figure 6
Figure 6
Theta power and running speed for correct versus incorrect trials. A. Running speed during the selection epoch. Animals ran significantly more slowly during the selection phase of incorrect trials compared to correct trials. Note that the selection epoch occurred before any cues indicated whether the animals had made a correct or incorrect decision. B. Normalized theta power for correct vs. incorrect trials during the reward epoch for all LFPs. Theta power was greater during incorrect trials for 80% of LFPs, even though there were no significant differences in running speed during the reward epoch. See also Figure S1 and Supplemental Text.
Figure 7
Figure 7
Phase-locking to theta in POR. A. Spike phase-locking to extracellular theta oscillations was observed in 38% of the 69 cells recorded simultaneously with the 42 LFPs. Examples shown here are from the same three representative LFPs shown in Figure 4 and Figure 5A. Left panel: mean phase = 152°, kappa = 1.25, ln(Rayleigh’s Z) = 6.57; Middle panel: Mean phase = 211°, kappa = 0.43, ln(Rayleigh’s Z) = 5.88; Right panel: Mean phase = 23°, kappa = 0.39, ln(Rayleigh’s Z) = 4.36. B. Distribution of Rayleigh’s Z for all cells recorded with LFPs. The Z-value distributions are shown in log form because some cells were strongly significant. The orange line is at ln(3) = 1.098 on the graph to indicate threshold for significance. Of the 69 cells, 26 showed significant phase locking to theta. C. Mean kappa score (orange line) and distribution for the 26 significantly phase-locked cells. All values of kappa > 1 are included in the right-most bin. D. Mean phase (orange line) and distribution of the 26 significantly phase-locked cells. E. Two POR cells recorded on the same stereotrode are phase locked to different phases of theta oscillations showing quite different phase preferences. For results of analyses of gamma see Figure S2 and Supplemental Text.

Similar articles

Cited by

References

    1. Agster KL, Burwell RD. Cortical efferents of the perirhinal, postrhinal, and entorhinal cortices of the rat. Hippocampus. 2009;19:1159–1186. - PMC - PubMed
    1. Aminoff E, Gronau N, Bar M. The parahippocampal cortex mediates spatial and nonspatial associations. Cereb Cortex. 2007;17:1493–1503. - PubMed
    1. Anagnostaras SG, Maren S, Fanselow MS. Temporally graded retrograde amnesia of contextual fear after hippocampal damage in rats: within-subjects examination. The Journal of neuroscience : the official journal of the Society for Neuroscience. 1999;19:1106–1114. - PMC - PubMed
    1. Atienza M, Crespo-Garcia M, Cantero JL. Semantic congruence enhances memory of episodic associations: role of theta oscillations. J Cogn Neurosci. 2011;23:75–90. - PubMed
    1. Badre D, Wagner AD. Left ventrolateral prefrontal cortex and the cognitive control of memory. Neuropsychologia. 2007;45:2883–2901. - PubMed

Publication types