. 2013 Mar 1;73(5):443-53.
doi: 10.1016/j.biopsych.2012.09.026. Epub 2012 Dec 4.

Synaptic dysfunction in the hippocampus accompanies learning and memory deficits in human immunodeficiency virus type-1 Tat transgenic mice

Affiliations

Synaptic dysfunction in the hippocampus accompanies learning and memory deficits in human immunodeficiency virus type-1 Tat transgenic mice

Sylvia Fitting et al. Biol Psychiatry. .

Abstract

Background: Human immunodeficiency virus (HIV) associated neurocognitive disorders (HAND), including memory dysfunction, continue to be a major clinical manifestation of HIV type-1 infection. Viral proteins released by infected glia are thought to be the principal triggers of inflammation and bystander neuronal injury and death, thereby driving key symptomatology of HAND.

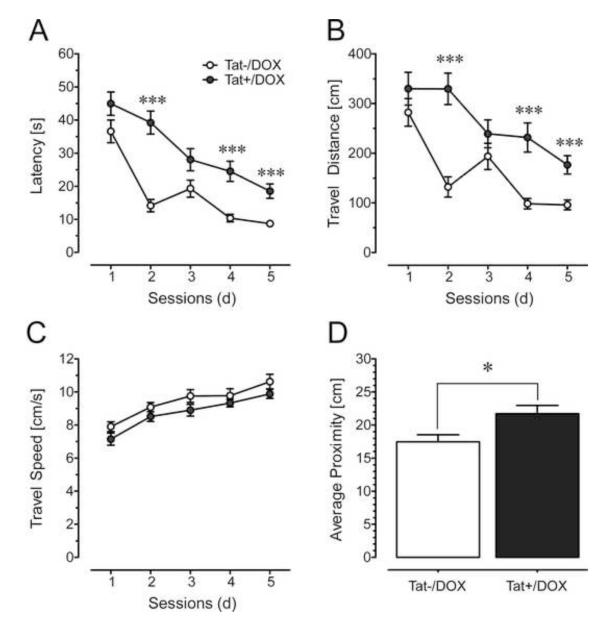
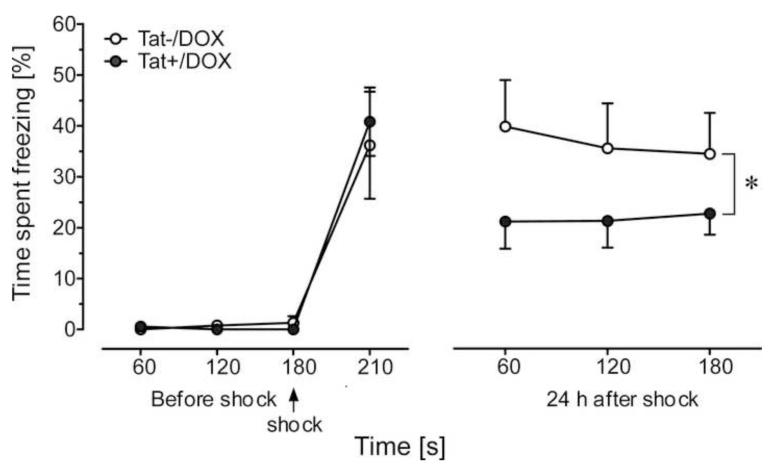
Methods: We used a glial fibrillary acidic protein-driven, doxycycline-inducible HIV type-1 transactivator of transcription (Tat) transgenic mouse model and examined structure-function relationships in hippocampal pyramidal cornu ammonis 1 (CA1) neurons using morphologic, electrophysiological (long-term potentiation [LTP]), and behavioral (Morris water maze, fear-conditioning) approaches.

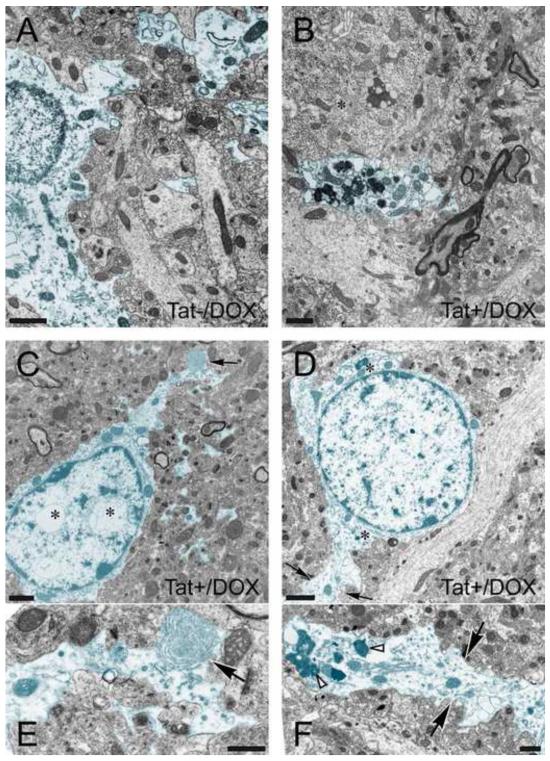
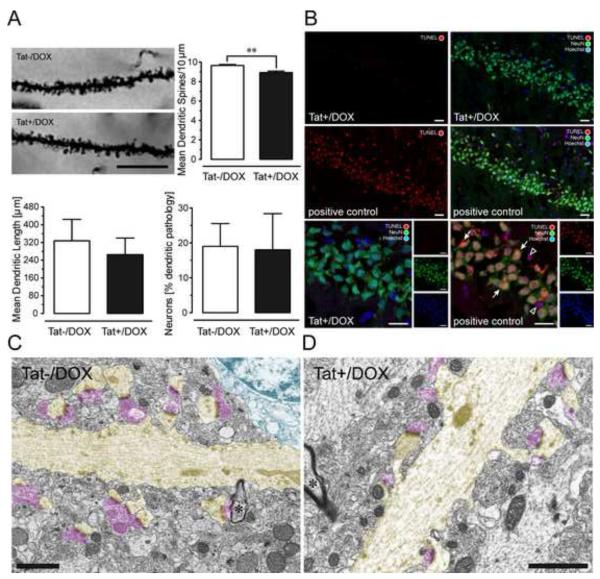
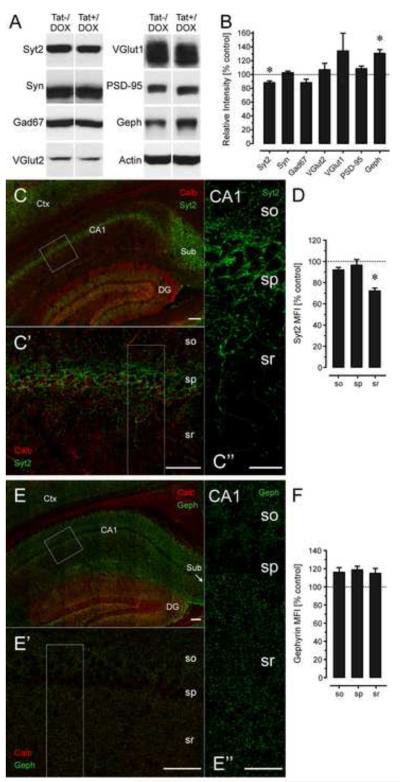
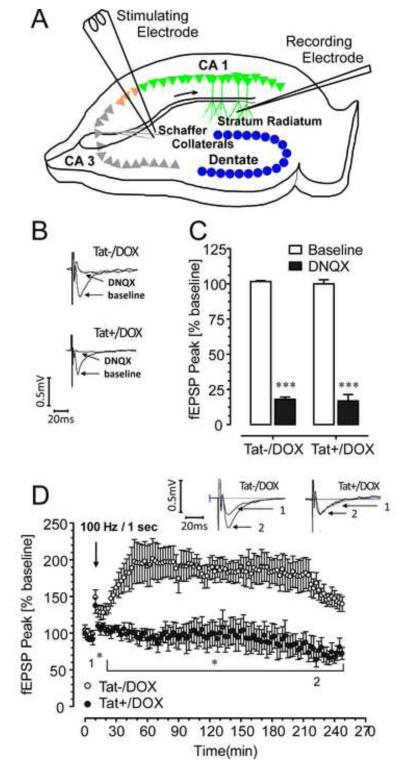
Results: Tat induction caused a variety of different inclusions in astrocytes characteristic of lysosomes, autophagic vacuoles, and lamellar bodies, which were typically present within distal cytoplasmic processes. In pyramidal CA1 neurons, Tat induction reduced the number of apical dendritic spines, while disrupting the distribution of synaptic proteins (synaptotagmin 2 and gephyrin) associated with inhibitory transmission but with minimal dendritic pathology and no evidence of pyramidal neuron death. Electrophysiological assessment of excitatory postsynaptic field potential at Schaffer collateral/commissural fiber-CA1 synapses showed near total suppression of LTP in mice expressing Tat. The loss in LTP coincided with disruptions in learning and memory.

Conclusions: Tat expression in the brain results in profound functional changes in synaptic physiology and in behavior that are accompanied by only modest structural changes and minimal pathology. Tat likely contributes to HAND by causing molecular changes that disrupt synaptic organization, with inhibitory presynaptic terminals containing synaptotagmin 2 appearing especially vulnerable.


Figures

Figure 1
Figure 1
Effects of Tat induction on the ultrastructure of astrocytes in CA1 region of the hippocampus (2-3-mo old mice). Astrocytes (highlighted in blue) from (A) control (Tat−/DOX) and (B-F) inducible, doxycycline (DOX) exposed Tat transgenic (Tat+/DOX) mice. (A) Astroglia in Tat−/DOX mice appear normal, displaying little or no pathology compared to astrocytes from Tat+/DOX animals. Grey matter astrocytes are distinguished from neurons by their lighter cytoplasm, are bordered by an irregular plasma membranes, lack organized cisternae of rough and large numbers of free ribosomes, lack microtubule bundles, possess more watery cytoplasm, and lack of synaptic contacts. (B-F) Astroglia in Tat+/DOX mice display increased numbers of inclusions with the features of lysosomes, autophagic vacuoles, and lamellar bodies compared to Tat−/DOX mice. In addition, the perikaryon above the astrocytic processes is that of a neuron (B, *). Note the abundance of endoplasmic reticulum-associated ribosomal clusters (Nissl bodies) and higher density of free ribosomes in the cytoplasm. (C) Whorls of membrane were occasionally seen within distal astrocyte processes (black arrow) shown at higher magnification in (E). Intranuclear vacuoles were present within the astrocyte cell body (D, *). (D) In the astrocyte highlighted in blue note the paucity of free ribosomes in the cytoplasm and very sparse rough endoplasmic reticulum (*). The black arrows denote the distal process of this astrocyte shown at higher magnification in (F). Numerous electron dense inclusions (white arrowheads) and vacuoles are present in this process. Scale bar for (A-D) = 1 μm, Scale bar for (E-F) = 0.5 μm.
Figure 2
Figure 2
(A) Effects of Tat induction on number of dendritic spines, dendritic length, and morphology on pyramidal neurons in the stratum radiatum of the hippocampal field CA1 (2-3-mo old mice). Spine density was assessed in Golgi-Kopsch impregnated neurons. Scale bars = 10 μm. Number of dendritic spines were counted on apical dendrites, recorded as the mean number of spines per 10 μm dendrite length, averaged for each animal, and reported as changes in the mean spine density (number of spines/10 μm). Significant decreases in total spine density were seen in the inducible (Tat+/DOX, n = 6) mice following induction with DOX compared to control (Tat−/DOX, n = 6) mice [**t(10) = 3.89, p < 0.01]. Length of apical dendrites was measured, since afferent synapses arriving from the Schaffer collaterals (see LTP studies below) preferentially ramify on apical dendrites within the stratum radiatum. For morphological assessment, each neuron was categorized either as having apical dendrites with an entirely normal morphology, or having an abnormal morphology, with one or more dendrites that displayed aberrant features, such as beading and fragmentation along proximal and/or distal segments [see also 51]. The proportion of neurons that possessed one or more dendrites with abnormal morphology was counted and reported as a percentage of total neurons examined. No effects were noted on dendritic length or dendritic morphology. Data are represented as mean (± SEM). (B) Effects of Tat induction on TUNEL detection in NeuN immunoreactive pyramidal neurons in the hippocampal field CA1. TUNEL was employed to detect in situ DNA fragmentation using the In Situ Cell Death Detection Kit, TMR red (Roche Applied Science, Indianapolis, IN). Positive control tissue for the TUNEL reaction was incubated with micrococcal nuclease or recombinant DNase I for 10 min at +15 to 25°C to induce DNA strand breaks prior to the TUNEL labeling procedure. TUNEL detection was almost never detected in the Tat+/DOX group (n = 4), whereas most Neu-N(+) and NeuN(−) TUNEL-positive cells were abundant in the positive control. The positive control indicates DNA fragmentation for NeuN immunoreactive neurons in the CA1 layer (arrow) as well as in cells that were not NeuN immunostained, likely representing glia (open arrowhead); DOX: doxycycline. (C-D) Electron micrographs of dendrites and associated postsynaptic spines (highlighted in yellow) in the CA1 region of the hippocampus of Tat+/DOX mice. Dendrites are distinguished from myelinated axons by their lighter cytoplasm, abundant microtubules, thicker diameter, and dendritic spines. The asterisk indicates a myelinated axon (*). Note continuity of dendrites with their spinous processes. Despite loss of function shown in Fig. 4 and changes in synaptic proteins shown in Fig. 3, the ultrastructure looks relatively normal in Tat+/DOX mice (D) comparable to Tat−/DOX mice (C). Both asymmetric synapses contacting dendritic spines, as well as the symmetric synapses on the dendritic shaft appeared qualitatively normal. Pre-synaptic elements highlighted in pink; Scale bar = 1 μm.
Figure 3
Figure 3
Effects of Tat induction on levels of synaptic markers by immunoblotting (A-B) and immunohistochemistry (C-F) in the CA1 region of the hippocampus of 3-mo old Tat−/DOX (n = 3) and Tat+/DOX (n = 3) mice. (A-B) Immunoblots demonstrate significant reductions in Syt2 [t(4) = 2.58, p < 0.05] and significant increases in gephyrin [t(4) = 2.24, p < 0.05] levels in Tat+/DOX compared to Tat−/DOX lysates, while levels of Syn, VGlut1, VGlut12, or PSD-95 were not markedly affected when normalized to actin levels. Significant decreases in Syt2 levels with corresponding increases in levels of gephyrin in Tat+/DOX mice suggest that Tat selectively targets inhibitory synapses associated with specific classes of hippocampal interneurons. (C-F) Syt2 (fixed tissue, green, C-D) or gephyrin (fresh tissue, green, E-F) MFI was determined from optical sections double-labeled with calbindin (red). (C-C’’) Syt2+ nerve terminals (green) are specifically present in the stratum pyramidalis of the CA1 region and sparsely distributed throughout the stratum oriens and stratum radiatum. C’ and C’’ are higher magnification images shown in rectangles in C and C’, respectively. (D) The density of Syt2+ nerve terminals was dramatically and selectively decreased for Tat+/DOX mice in the stratum radiatum of CA1 compared to the Tat−/DOX mice [t(4) = 4.00, p < 0.01], while corresponding reductions in Syt2+ terminals were not evident in the stratum pyramidal or stratum oriens. (E-E’’) Gephyrin+ postsynaptic puncta (green) were uniformly distributed throughout the stratum oriens and stratum radiatum, but displaying reduced density in the stratum pyramidalis that coincided with the physical presence of the pyramidal neuron perikarya. E’ and E’’ are higher magnification images shown in rectangles in E and E’, respectively. Although gephyrin MFI shows a decline in the stratum pyramidalis, this was consistent in Tat−/DOX and Tat+/DOX mice such that no relative difference was noted when comparing the two strains (F). Dashed lines represent control levels. Data are mean ± SEM. *p < 0.05; Syt2: synaptotagmin 2; Syn: Synapsin; Gad67: glutamate decarboxylase 67; VGlut1: vesicular glutamate transporters 1; VGlut2: vesicular glutamate transporters 2; PSD-95: postsynaptic density protein 95; Geph: gephyrin; Scale bars = 100 μm in C and E (20x objective), 50 μm in C’ and E’ (63x objective), 20 μm in C’’ and E’’ (63x objective); CA1: Cornu ammonis 1 region; DG: dentate gyrus; so: stratum oriens; sp: stratum pyramidalis; sr: stratum radiatum; calb: calbindin; MFI: mean fluorescence intensity.
Figure 4
Figure 4
Effects of Tat induction on synaptic transmission and synaptic plasticity. (A) Diagram of a transverse hippocampal slice, indicating the recording and stimulating electrode placements used to measure field excitatory postsynaptic potentials (fEPSP) in 1-mo old mice. (B) The amplitudes of the field potentials show representative traces for Tat−/DOX and Tat+/DOX mice before (control) and in the presence of 20 μM DNQX. (C) The average fEPSP peak data show a significant reduction of the fEPSP peak in the presence of DNQX. No significant difference was noted between the Tat−/DOX and Tat+/DOX mice for the baseline responses (control). (D) The fEPSP peak of LTP was significantly (p < 0.01) reduced in inducible (Tat+/DOX) mice (filled circles; n = 4) compared to control (Tat−/DOX) mice (open circles; n = 4). Insets show representative traces for both groups recorded before (indicated by 1) and 220 min after applying HFS (indicated by 2). The significant difference between LTP control and inducible mice is indicated in the graph (*p < 0.05 for the time period indicated by the bracket). HFS: high-frequency stimulation; *p < 0.05, ***p < 0.001; DOX: doxycycline.
Figure 5
Figure 5
Effects of Tat induction in the Morris water maze in acquisition training across session (A-C) and the probe test (D) for 2-3-mo old mice (mean ± SEM). (A-C) Two-way mixed ANOVAs were conducted with Tat induction as a between-subjects factor (2 levels) and session number (the data from 4 trials within each session were combined) as a within-subjects factor (5 levels). (A) Escape latency is increased for Tat+/DOX mice (n = 9) [main effect of Tat: F(1, 16) = 49.47, p < 0.001], indicating longer search times for Tat+/DOX mice to find the hidden platform compared to the control (Tat−/DOX, n = 9) mice. Post hoc tests conducted for each session reveal significant differences between the two groups for sessions 2, 4 and 5. There is also a learning effect across session for both groups expressed in a significant main effect of time [F(4, 64) = 25.84, pGG < 0.001]. A Tat induction x session interaction [F(4, 64) = 2.88, pGG < 0.05] indicates that with time, Tat−/DOX mice learn to find the hidden platform more rapidly than transgenic mice following Tat induction (Tat+/DOX). (B) Travel distance is increased for Tat+/DOX mice [main effect of Tat: F(1, 16) = 36.02, p < 0.001], with post hoc tests indicating that Tat+/DOX mice routinely swim longer distances before finding the platform for all sessions except at 3 d. There is also a learning effect across session for both groups [F(4, 64) = 13.39, pGG < 0.001] as well as a significant Tat induction x session interaction [F(4, 64) = 3.32, pGG < 0.05]. (C) Travel speed (cm/s) indicated a modest effect in the ANOVA for Tat induction [F(1, 16) = 6.38, p < 0.05] that however did not hold up in post hoc tests. Further, a significant session effect was noted, with both groups swimming faster across session [F(4, 64) = 14.26, pGG < 0.001]. No Tat induction x session interaction was noted. (D) For the probe test, conducted 2 d after the last acquisition session, a one-way ANOVA was conducted with Tat induction as a between-subjects factor (2 levels). The proximity index (cm) indicated that control mice swim more closely to the previous location of the platform compared to the Tat+/DOX mice [Tat induction effect: F(1, 15) = 6.54, p < 0.05]. ***p < 0.001, *p < 0.05; DOX: doxycycline.
Figure 6
Figure 6
Effect of Tat induction on contextual fear-conditioning assessments. No differences were observed in the freezing behavior of Tat−/DOX and Tat+/DOX mice either before or immediately after a conditioning foot shock (indicated by arrow, 3 min after baseline measures). However, there was a significant decrease in freezing behavior observed in mice expressing Tat protein (Tat+/DOX, n = 9) 24 h after foot shock conditioning, as compared to control Tat−/DOX [n = 7; main effect of group: F(2,42) = 7.44, *p < 0.01] group. Data are mean ± SEM. DOX: doxycycline.

Similar articles

Cited by

References

    1. Hebb DO. The organization of behavior. Wiley & Sons; New York: 1949.
    1. Dayhoff JE. Computational properties of networks of synchronous groups of spiking neurons. Neural Comput. 2007;19:2433–2467. - PubMed
    1. Globus A, Scheibel AB. Loss of dendrite spines as an index of pre-synaptic terminal patterns. Nature. 1966;212:463–465. - PubMed
    1. Kruman I, Nath A, Mattson MP. HIV-1 protein Tat induces apoptosis of hippocampal neurons by a mechanism involving caspase activation, calcium overload, and oxidative stress. Exp Neurol. 1998;154:276–288. - PubMed
    1. Sheng M, Kim MJ. Postsynaptic signaling and plasticity mechanisms. Science. 2002;298:776–780. - PubMed

Publication types

MeSH terms

Substances