

A new perceptual difference model for diagnostically relevant quantitative image quality evaluation: a preliminary study
- PMID: 23218792
- PMCID: PMC3610792
- DOI: 10.1016/j.mri.2012.09.009
A new perceptual difference model for diagnostically relevant quantitative image quality evaluation: a preliminary study
Abstract
Purpose: Most objective image quality metrics average over a wide range of image degradations. However, human clinicians demonstrate bias toward different types of artifacts. Here, we aim to create a perceptual difference model based on Case-PDM that mimics the preference of human observers toward different artifacts.
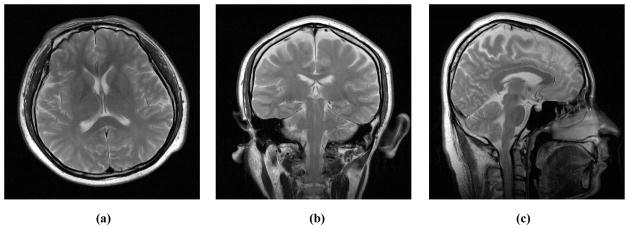
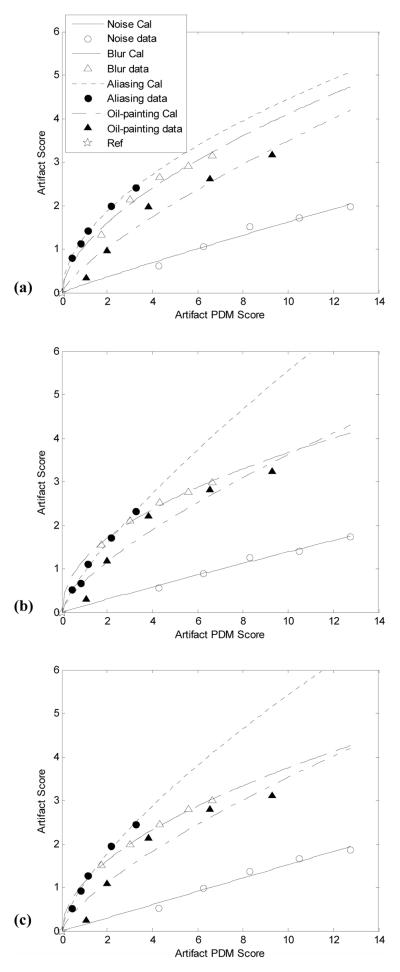
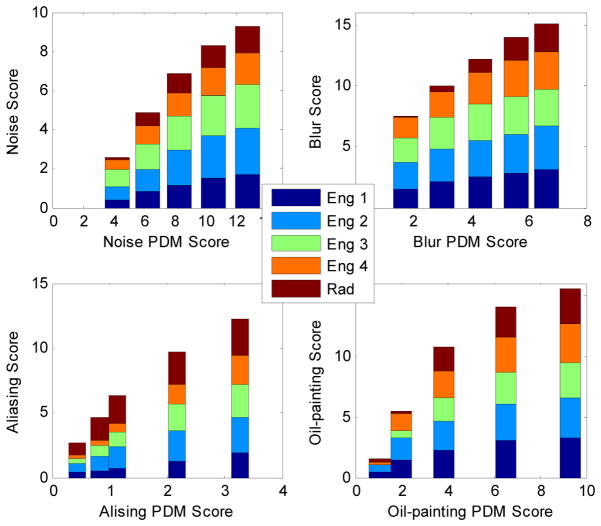
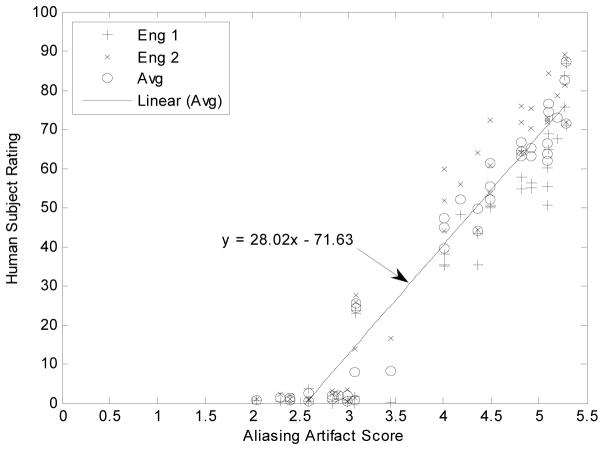
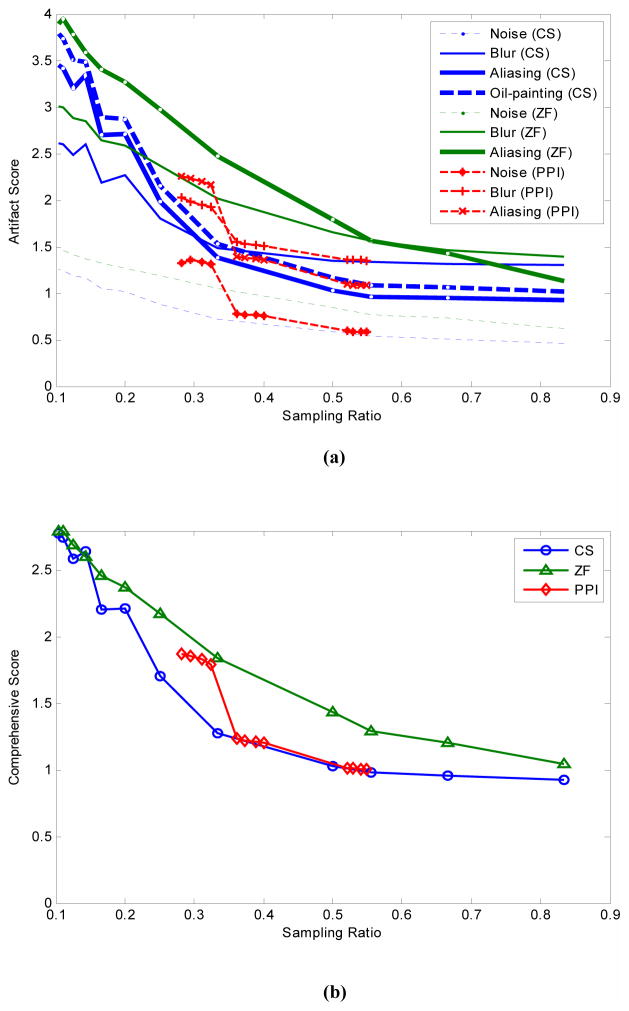
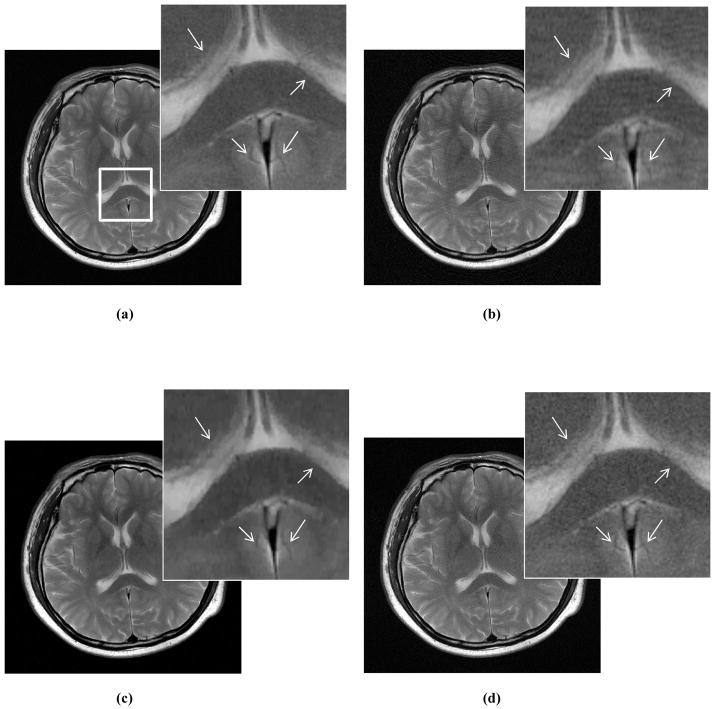
Method: We measured artifact disturbance to observers and calibrated the novel perceptual difference model (PDM). To tune the new model, which we call Artifact-PDM, degradations were synthetically added to three healthy brain MR data sets. Four types of artifacts (noise, blur, aliasing or "oil painting" which shows up as flattened, over-smoothened regions) of standard compressed sensing (CS) reconstruction, within a reasonable range of artifact severity, as measured by both PDM and visual inspection, were considered. After the model parameters were tuned by each synthetic image, we used a functional measurement theory pair-comparison experiment to measure the disturbance of each artifact to human observers and determine the weights of each artifact's PDM score. To validate Artifact-PDM, human ratings obtained from a Double Stimulus Continuous Quality Scale experiment were compared to the model for noise, blur, aliasing, oil painting and overall qualities using a large set of CS-reconstructed MR images of varying quality. Finally, we used this new approach to compare CS to GRAPPA, a parallel MRI reconstruction algorithm.
Results: We found that, for the same Artifact-PDM score, the human observer found incoherent aliasing to be the most disturbing and noise the least. Artifact-PDM results were highly correlated to human observers in both experiments. Optimized CS reconstruction quality compared favorably to GRAPPA's for the same sampling ratio.
Conclusions: We conclude our novel metric can faithfully represent human observer artifact evaluation and can be useful in evaluating CS and GRAPPA reconstruction algorithms, especially in studying artifact trade-offs.
Copyright © 2013 Elsevier Inc. All rights reserved.
Figures
References
-
- Griswold MA. What Past Recon Methods Lack in the New World of MRI. 2009; ISMRM workshop on Data Sampling and Image Reconstruction; Sedona, AZ, USA.
-
- Pauly JM. What New Recon Methods Still Require in Order to Be Useful. 2009; ISMRM Workshop on Data Sampling and Image Reconstruction; Sedona, AZ, USA.
-
- Duensing GR, Huang F. Objective Comparison of Alternate Reconstruction Evaluation Strategies: An Unmet Need. 2008; International Society for Magnetic Resonance in Medicine; Toronto, Canada.
-
- Huo D, Wilson D, Griswold M, Blaimer M. Potential Pitfalls of Including Reference Data in Parallel Imaging Reconstructions at High Acceleration. 2006 May; Proceedings 13th Scientific Meeting, International Society for Magnetic Resonance in Medicine; Seattle. p. 287.
-
- Girod B. What’s wrong with mean-squared error? In: Watson AB, editor. Digital Images and Human Vision. Cambridge, Massachusetts: MIT Press; 1993. pp. 207–220.
Publication types
MeSH terms
Grants and funding
LinkOut - more resources
Full Text Sources
Other Literature Sources
Medical
Miscellaneous
