. 2013 Mar;25(3):639-50.
doi: 10.1016/j.cellsig.2012.11.026. Epub 2012 Dec 5.

Distinct signaling pathways regulate TLR2 co-stimulatory function in human T cells

Affiliations

Distinct signaling pathways regulate TLR2 co-stimulatory function in human T cells

Nicole M Chapman et al. Cell Signal. 2013 Mar.

Abstract

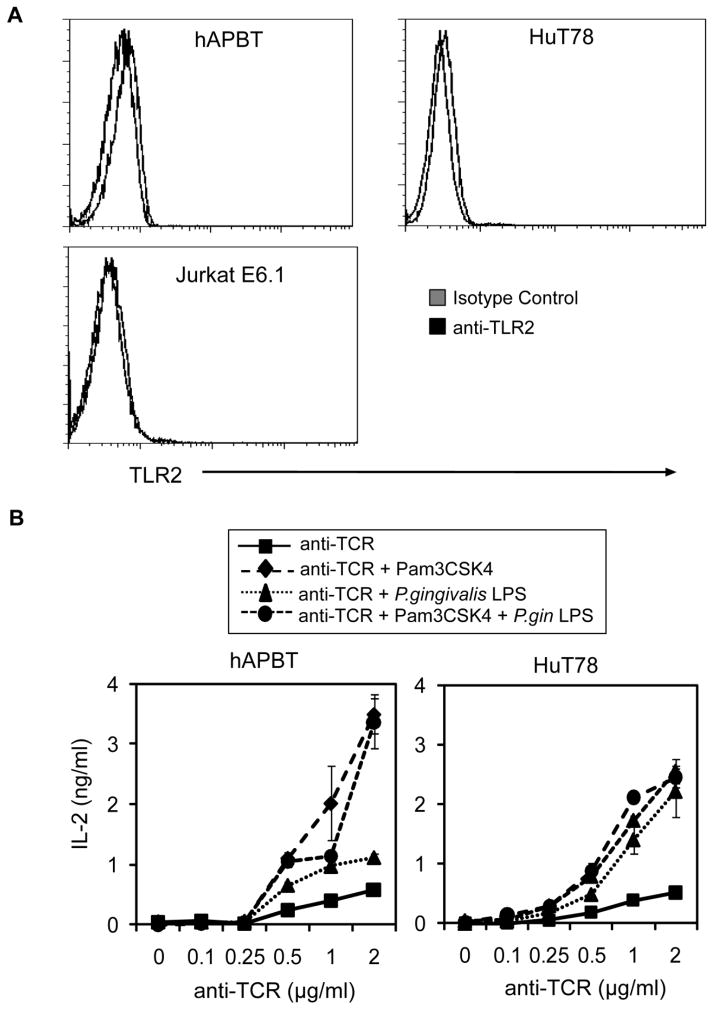
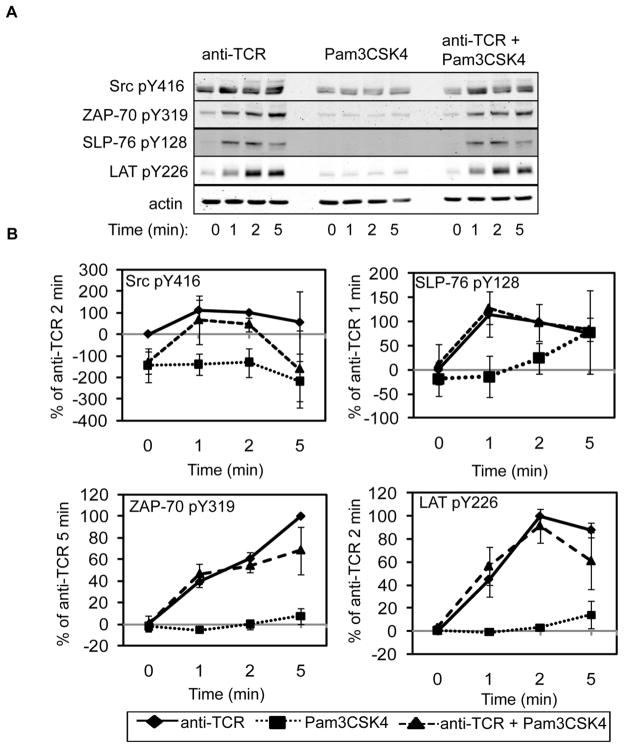
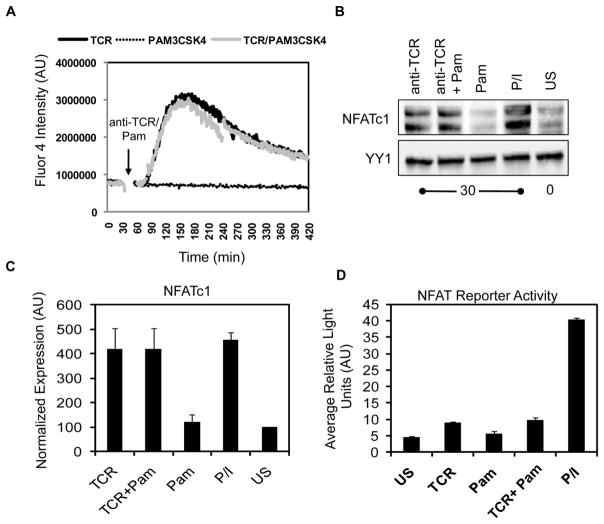
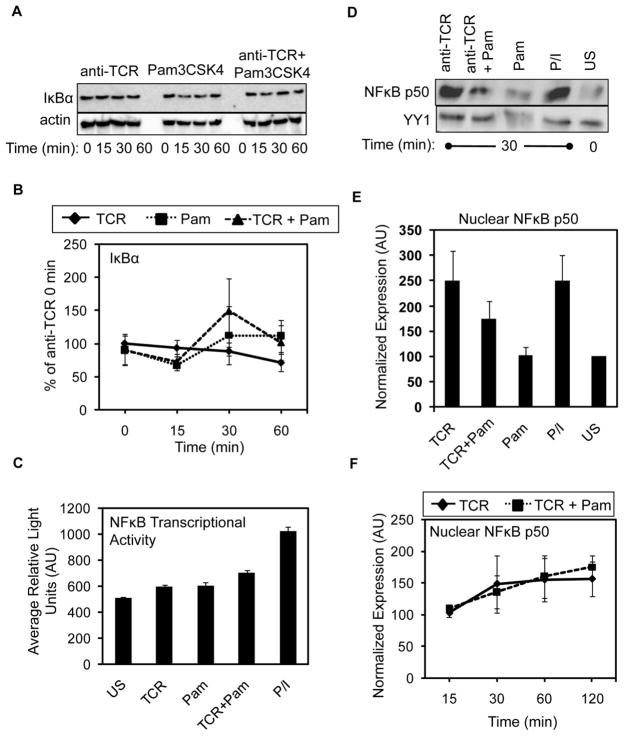
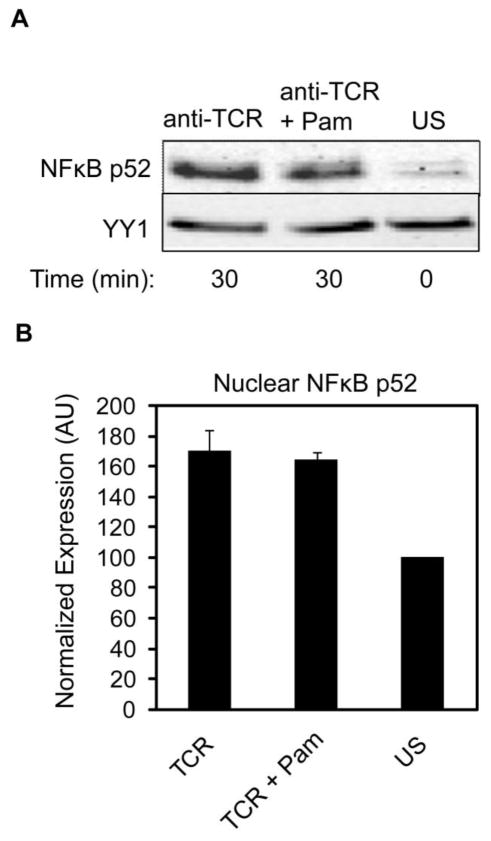
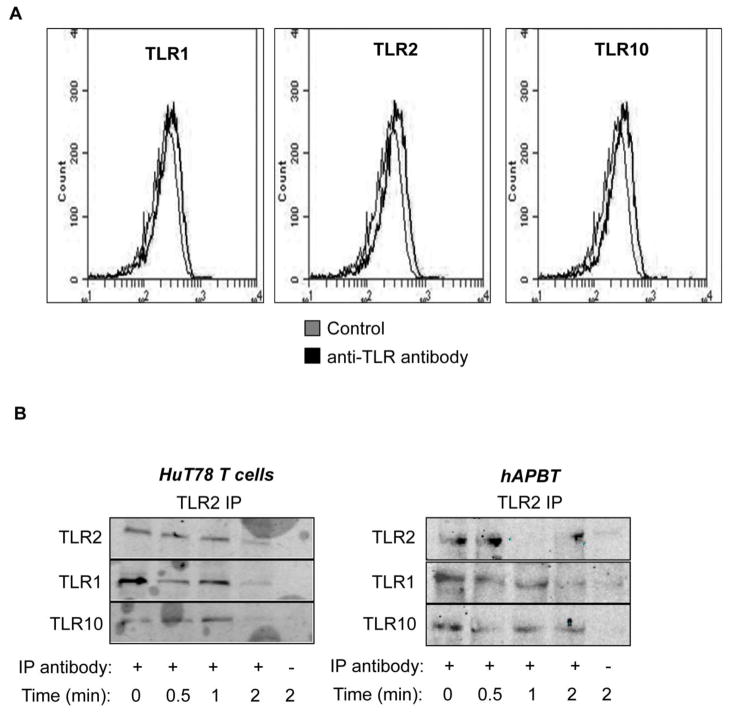
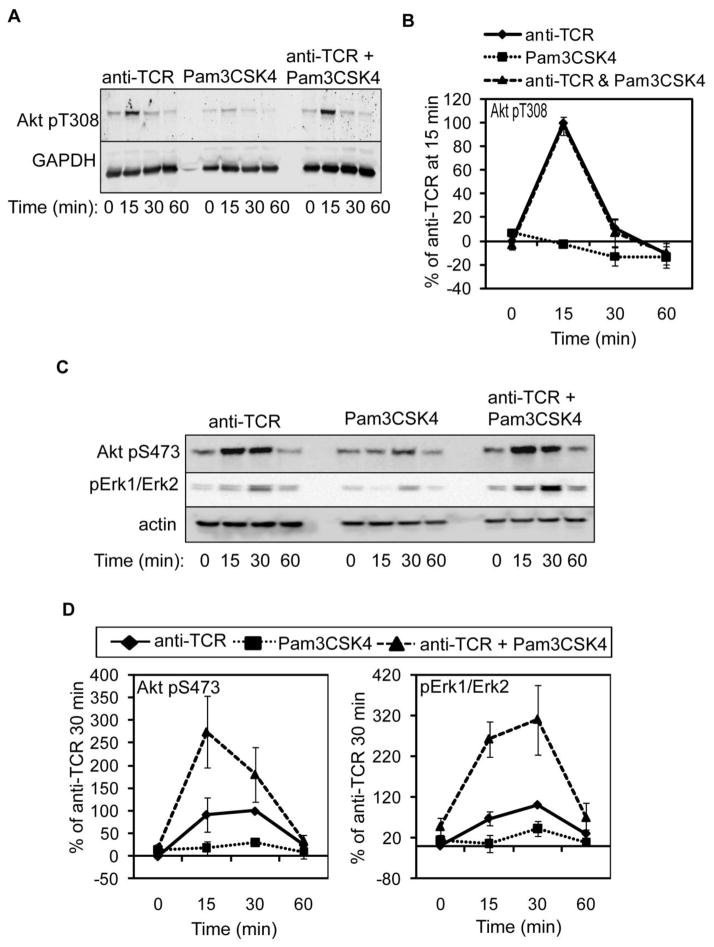
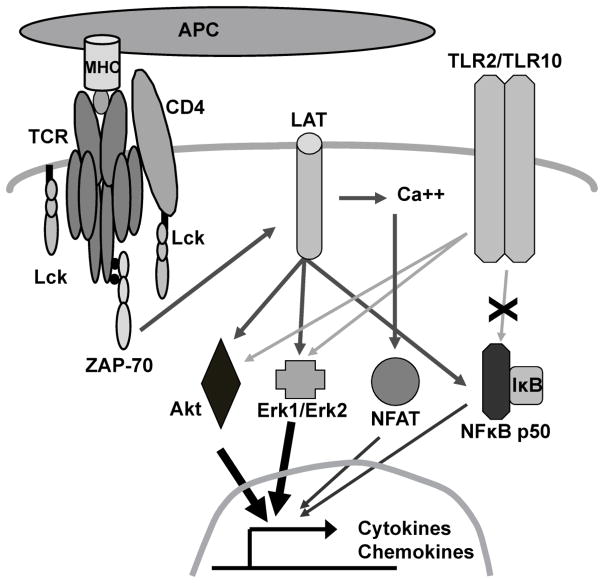
Toll-like receptor 2 (TLR2) serves as a co-stimulatory receptor for human T cells by enhancing T cell receptor (TCR)-induced cytokine production and proliferation. However, it is unknown where signals from the TCR and TLR2 converge to enhance T cell activation. To address this gap, we examined changes in TCR-induced signaling following concurrent TLR2 activation in human T cells. Both proximal TCR-mediated signaling and early NFκB activation were not enhanced by TCR and TLR2 co-activation, potentially due to the association of TLR2 with TLR10. Instead, TLR2 co-induction did augment Akt and Erk1/Erk2 activation in human T cells. These findings demonstrate that TLR2 activates distinct signaling pathways in human T cells and suggest that alterations in expression of TLR2 co-receptors may contribute to aberrant T cell responses.


Figures

Figure 1
Figure 1. TLR2 is a co-stimulatory receptor for human APBTs and HuT78 cells
(A) TLR2 surface expression in unstimulated Jurkat E6.1 cells (left panel), HuT78 T cells (middle panel), or hAPBTs (right panel) was examined by flow cytometry. (B) hAPBTs (left panel) or HuT78 cells (right panel) were stimulated for 24 hours with various doses of anti-CD3 in the absence or presence of the TLR2 ligands, PAM3CSK4 and/or P. gingivalis LPS. IL-2 in the culture supernatants was detected by ELISA.
Figure 2
Figure 2. TLR2 co-activation does not enhance early TCR-induced signaling in HuT78 cells
(A) HuT78 T cells were stimulated for various times with soluble anti-CD3 and soluble PAM3CSK4 alone or in combination. Cellular lysates were resolved by PAGE and immunoblotting was used to examine the site specific phosphorylation of Lck/Fyn, ZAP-70, SLP-76, and LAT. Actin was used as a loading control. Data is representative of three independent experiments. (B) Average normalized results ± SEM for all three independent replicates are shown graphically.
Figure 3
Figure 3. TCR-induced Ca2+ influx and NFAT activation are not increased by concurrent TLR2 stimulation in human T cells
(A) HuT78 T cells were stimulated with soluble anti-CD3 and soluble PAM3CSK4 alone or in combination. Ca2+ influx over time was measured by flow cytometry. Data is representative of three independent experiments. (B) hAPBTs were stimulated with soluble anti-CD3 and anti-CD4, soluble PAM3CSK4, or all three stimuli for 30 minutes. Unstimulated APBTs and APBTs stimulated with PMA and ionomycin (P/I) for 30 minutes served as controls. Immunoblotting was used to detect NFATc1 and YY1 in nuclear extracts. Data is representative of three experiments. (C) Normalized nuclear NFATc1 expression was calculated and the mean ± SEM for all three independent replicates was graphed. (D) NFAT reporter activity was measured in HuT78 T cells stimulated for 8 hours with plate-bound anti-CD3, Pam3CSK4, or both stimuli. Cells stimulated with P/I for 6 hours served as a positive control. The graph shows the mean of duplicate samples ± SD, and the data are representative of three independent experiments.
Figure 4
Figure 4. TCR-induced activation of the classical NFκB pathway is not increased upon simultaneousTLR2 engagement
(A) HuT78 T cells were stimulated for various times as in Figure 2. The expression of IκBα and actin were analyzed by immunoblotting. Data is representative of three independent experiments. (B) Quantification of IκBα degradation is shown graphically as the average ± SEM for three independent replicates. (C) Luciferase activity in HuT78 cells stimulated with anti-CD3, Pam3CSK4, both, or PMA and ionomycin for 6 hours. Graph shows mean of duplicate samples ± SD and data are representative of three experiments. (D) APBTs were stimulated with anti-CD3 and anti-CD4, PAM3CSK4, or all three stimuli for 30 minutes. Control HuT78 T cells were not treated or were stimulated with PMA and ionomycin (P/I). Nuclear extracts were probed for p50 and YY1 expression by immunoblotting. The data shown represents four independent experiments. (E) Average normalized nuclear p50 expression ± SEM for the four independent experiments was calculated and graphed. (F) APBTs were stimulated as in (D) for various times. NFκB p50 and YY1 expression in nuclear extracts were detected by immunoblotting. The mean nuclear p50 expression from three independent experiments ± SEM is shown.
Figure 5
Figure 5. TCR-induced nuclear translocation of NFκB p52 is not increased by TLR2 co-activation
hAPBTs were stimulated with anti-CD3 and anti-CD4 and Pam3CSK4, alone or in combination, for 30 minutes. The expression of NFκB p52 and YY1 were detected in nuclear extracts by immunoblotting. Data is representative of three experiments. (B) Normalized average p52 translocation ± SEM from three independent replicates was calculated and graphed.
Figure 6
Figure 6. TLR2 complexes with both TLR1 and TLR10 in human T cells
(A) Surface expression of LR1 (left panel), TLR2 (middle panel), and TLR10 (right panel) in HuT78 T cells was examined by flow cytometry. Data is representative of two independent experiments. (B) HuT78 T cells or hAPBTs were stimulated for various times with 5 μg/ml of Pam3CSK4. TLR2 was immunoprecipitated from HuT78 T cells (left) or from hAPBTs (right) with anti-TLR2. The amount of TLR1 and TLR10 associated with TLR2 was assessed by immunoblotting. Blots are representative of at least two independent experiments.
Figure 7
Figure 7. TLR2 co-engagement augments TCR-mediated Akt and Erk1/Erk2 phosphorylation in HuT78 cells
HuT78 T cells were stimulated for various times as in Figure 2. (A) The phosphorylation of Akt threonine 308 and GAPDH expression or (C) Akt serine 473 and Erk1/Erk2 phosphorylation and actin expression were detected by immunoblotting. A representative of three independent experiments is shown. (B and D) Results were normalized and the average of three independent replicates ± SEM was graphed.
Figure 8
Figure 8
Proposed model for TLR2 co-stimulation in human T cells

Similar articles

Cited by

References

    1. Smith-Garvin JE, Koretzky GA, Jordan MS. Annual review of immunology. 2009;27:591–619. - PMC - PubMed
    1. Nel AE. The Journal of allergy and clinical immunology. 2002;109:758–770. - PubMed
    1. Kane LP, Weiss A. Immunol Rev. 2003;192:7–20. - PubMed
    1. Cruz-Orcutt N, Houtman JC. Molecular immunology. 2009;46:2274–2283. - PubMed
    1. Lloyd CM, Hessel EM. Nature reviews Immunology. 2010;10:838–848. - PMC - PubMed

Publication types

MeSH terms

LinkOut - more resources