. 2013 Mar;1833(3):573-82.
doi: 10.1016/j.bbamcr.2012.11.021. Epub 2012 Dec 4.

Gastrointestinal hormones stimulate growth of Foregut Neuroendocrine Tumors by transactivating the EGF receptor

Affiliations

Gastrointestinal hormones stimulate growth of Foregut Neuroendocrine Tumors by transactivating the EGF receptor

Alessia Di Florio et al. Biochim Biophys Acta. 2013 Mar.

Abstract

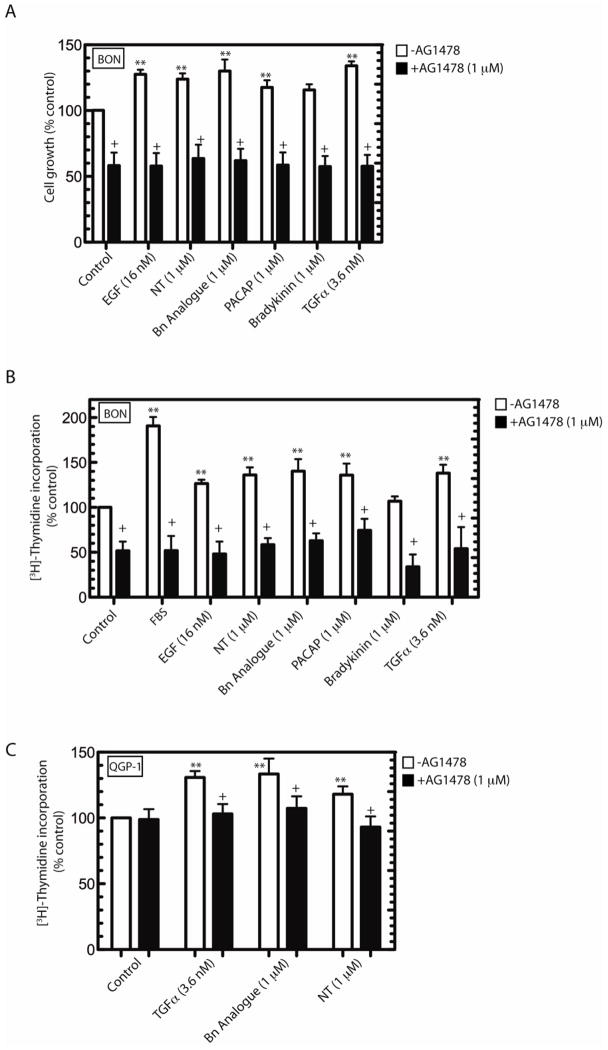
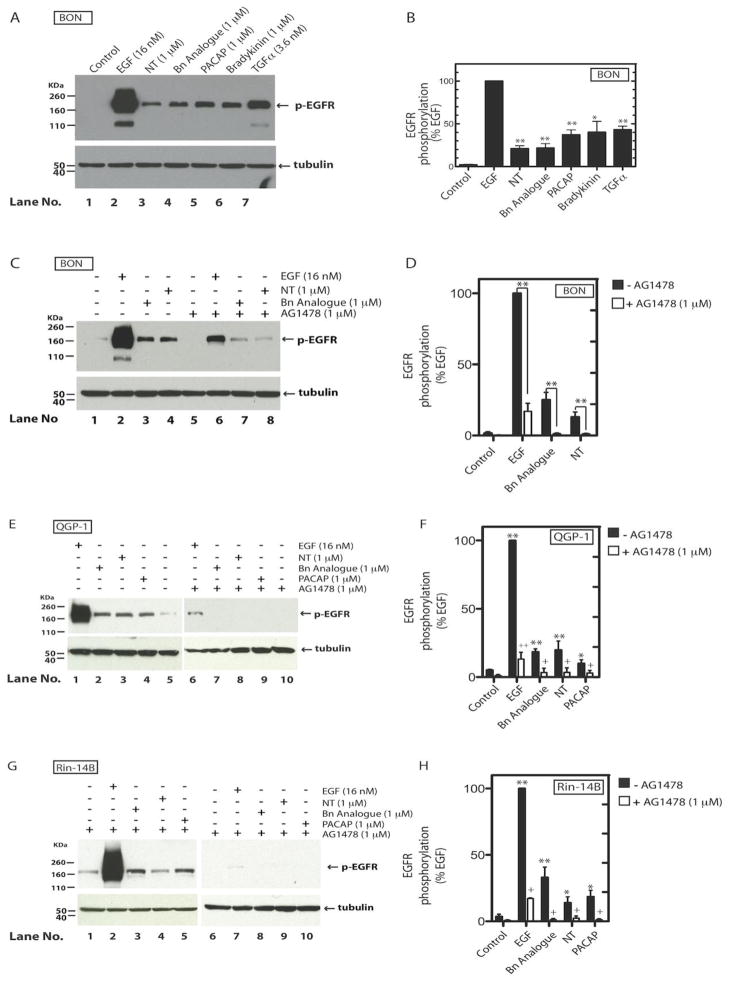
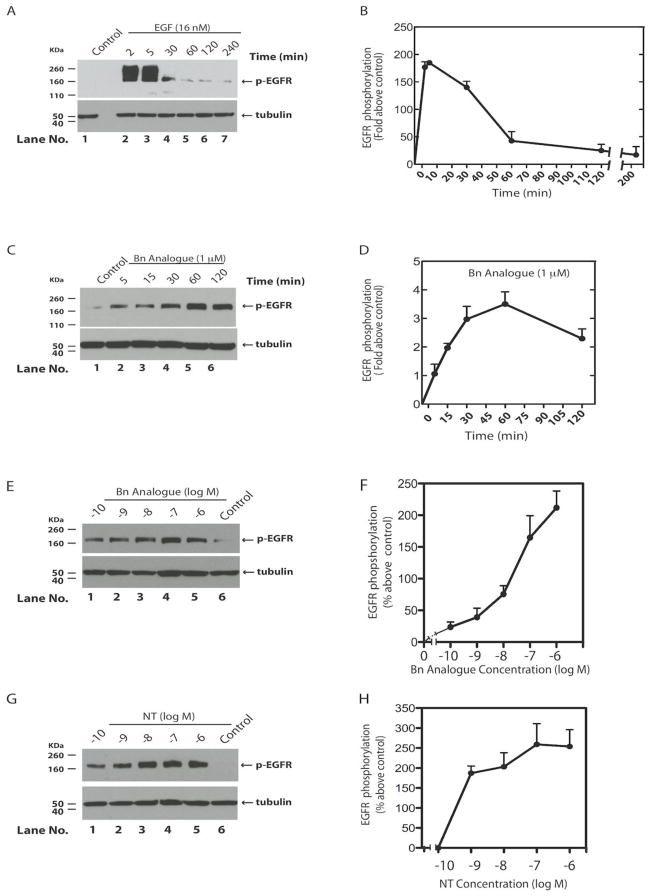
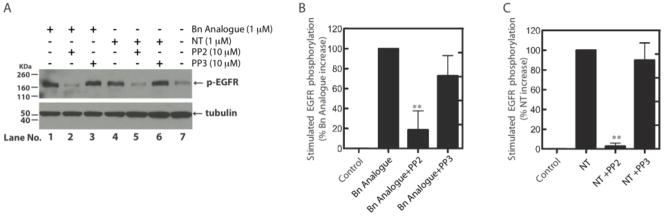
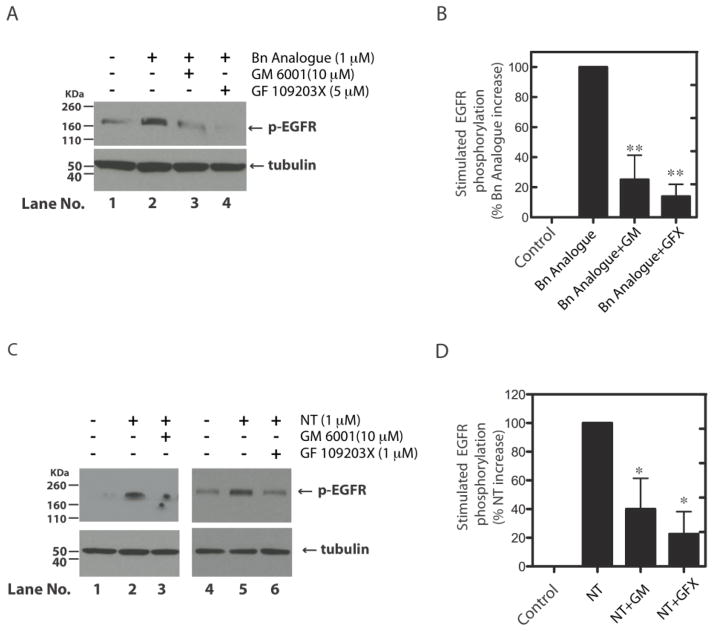
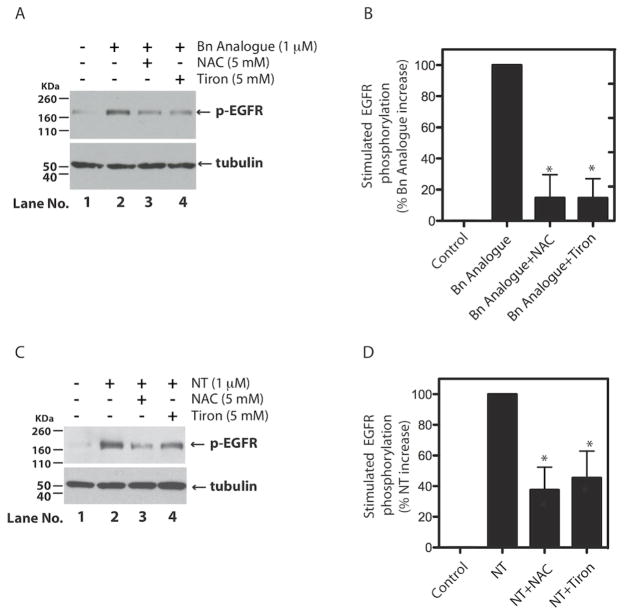
Foregut neuroendocrine tumors [NETs] usually pursuit a benign course, but some show aggressive behavior. The treatment of patients with advanced NETs is marginally effective and new approaches are needed. In other tumors, transactivation of the EGF receptor (EGFR) by growth factors, gastrointestinal (GI) hormones and lipids can stimulate growth, which has led to new treatments. Recent studies show a direct correlation between NET malignancy and EGFR expression, EGFR inhibition decreases basal NET growth and an autocrine growth effect exerted by GI hormones, for some NETs. To determine if GI hormones can stimulate NET growth by inducing transactivation of EGFR, we examined the ability of EGF, TGFα and various GI hormones to stimulate growth of the human foregut carcinoid,BON, the somatostatinoma QGP-1 and the rat islet tumor,Rin-14B-cell lines. The EGFR tyrosine-kinase inhibitor, AG1478 strongly inhibited EGF and the GI hormones stimulated cell growth, both in BON and QGP-1 cells. In all the three neuroendocrine cell lines studied, we found EGF, TGFα and the other growth-stimulating GI hormones increased Tyr(1068) EGFR phosphorylation. In BON cells, both the GI hormones neurotensin and a bombesin analogue caused a time- and dose-dependent increase in EGFR phosphorylation, which was strongly inhibited by AG1478. Moreover, we found this stimulated phosphorylation was dependent on Src kinases, PKCs, matrix metalloproteinase activation and the generation of reactive oxygen species. These results raise the possibility that disruption of this signaling cascade by either EGFR inhibition alone or combined with receptor antagonists may be a novel therapeutic approach for treatment of foregut NETs/PETs.


Figures

Figure 1
Figure 1. Effect of the EGFR inhibitor, AG1478 on growth of BON and QGP-1 neuroendocrine tumor cells stimulated by EGF, TGFα and various GI hormones
BON and QGP-1 cells were incubated for 24 hours, in serum-free medium, either with EGF, TGFα or the indicated GI hormones, at the indicated concentrations, in the presence or in the absence of the EGFR inhibitor, AG1478 (1 μM). Cell growth was evaluated by either an MTT assay (A) or measuring [3H]-Thymidine uptake (B) for BON cells, and measuring [3H]-Thymidine uptake for QGP-1 cells (C). **p< 0.01 stimulants vs. control; +p<0.01 stimulants vs. AG1478 co-treatment. Results are mean±SEM from 6 experiments.
Figure 2
Figure 2. Ability of EGF, TGFα or various GI hormones to stimulate EGFR tyrosine 1068 phosphorylation and the effect of the EGFR inhibitor, AG1478 in BON cells (Panels A–D) and in QGP-1 and Rin-14B neuroendocrine tumor cells (Panels E–H)
Left panels (Panels A, C, E, G) show representative Western blot analysis of EGFR Y1068 phosphorylation of the indicated NET cells treated for 30 min with EGF, TGFα or the various GI hormones at the indicated concentrations (these experiments are representative of 4 others). Right panels (Panels B, D, F, H) show the results of the densitometric analysis of the stimulation of EGFR Y1068 phosphorylation shown in the corresponding left panel for the indicated NET cells. Shown are means± SEM from 4 separate experiments **p< 0.01; *p<0.05 vs. no AG1478.
Figure 3
Figure 3. Time courses (Panels A–D) of EGFR Tyrosine 1068 phosphorylation stimulation (EGF, the Bn-analogue) and Dose-response stimulation (Panels E–H) (NT, the Bn-analogue) in BON cells
Left panels (Panels A, C, E, G) show a representative Western blot analysis of EGFR Y1068 phosphorylation in BON cells treated with EGF (16 nM) (Panel A), Bn-analogue (1 μM) (Panel C) or NT (1 μM) (Panel G), at the indicated times. This experiment is representative of 4 others. The right panels (Panels B, D, F, H) show the results of a densitometric analysis of results of experiments shown in the accompanying left panel. Shown are mean± SEM of EGFR Y1068 phosphorylation induced by EGF (Panel B), Bn-analogue (Panel D) or NT (Panel H) treatments. Results are the mean± SEM of 4 separate experiments.
Figure 4
Figure 4. Effect of Src inhibition on EGFR-transactivation by Bn-analogue and NT in BON cells
(A) Representative Western blot analysis of EGFR Y1068 phosphorylation of BON cells treated with Bn-analogue (1 μM) or NT (1 μM) for 1 hour, with or without the Src inhibitor PP2, (10 μM) or its inactive related peptide, PP3 (10 μM). This result is representative of 4 others. (B, C) Densitometric analysis of the EGFR phosphorylation, induced by Bn-analogue (B) or NT (C), shown in panel A. Results are expressed as the mean± SEM of 4 experiments. **p<0.01 vs. stimulant alone.
Figure 5
Figure 5. The effect of PKC inhibition or inhibition of metalloproteinases (MMPs) on EGFR-transactivation induced by Bn-analogue or NT, in BON cells
(A, C) Representative Western blot analysis of EGFR Y1068 phosphorylation of BON cells treated with Bn-analogue (1 μM) (A) or NT (1 μM) (C) for 1 hour, with or without the PKC inhibitor, GF 109203X or the MMP inhibitor, GM 6001. These experiments are representative of 3 different experiments. (B, D) Densitometric analysis of the effect of inhibition of PKC or MMP, on EGFR phosphorylation, induced by Bn-analogue (B) and NT (D), as shown in panels A and C. Results are the mean± SEM of 3 experiments. **p< 0.01; *p<0.05 vs. stimulant alone.
Figure 6
Figure 6. Effect of reactive oxygen species (ROS) inhibition on EGFR-transactivation induced by Bn-analogue or NT, in BON cells
(A, C) Representative Western blot analysis of EGFR Y1068 phosphorylation of BON cells treated with Bn-analogue (1 μM) (A) or NT (1 μM) (C) for 1 hour, with or without the ROS production inhibitors, N-acetylcysteine (NAC) or Tiron. These experiments are representative of 3 different experiments. (B, D) Densitometric analysis of the effect of inhibition of PKC or MMP, on EGFR phosphorylation, induced by Bn-analogue (B) and NT (D), as shown in panels A and C. Results are the mean± SEM of 3 experiments. *p<0.05 vs. stimulant alone.

References

    1. Jensen RT, Delle Fave G. Promising advances in the treatment of malignant pancreatic endocrine tumors. N Engl J Med. 2011;364:564–565. - PubMed
    1. Schimmack S, Svejda B, Lawrence B, Kidd M, Modlin IM. The diversity and commonalities of gastroenteropancreatic neuroendocrine tumors. Langenbecks Arch Surg. 2011;396:273–298. - PubMed
    1. Capurso G, Fazio N, Festa S, Panzuto F, de Braud F, Delle Fave G. Molecular target therapy for gastroenteropancreatic endocrine tumours: biological rationale and clinical perspectives. Crit Rev Oncol Hematol. 2009;72:110–124. - PubMed
    1. Metz DC, Jensen RT. Gastrointestinal neuroendocrine tumors:; Pancreatic endocrine tumors. Gastroenterology. 2008;135:1469–1492. - PMC - PubMed
    1. Ito T, Igarashi H, Jensen RT. Therapy of metastatic pancreatic neuroendocrine tumors (pNETs): recent insights and advances. J Gastroenterol. 2012;47:941–960. - PMC - PubMed

Publication types

MeSH terms